emooki
HomePrice mapTransactions
🇬🇧 English🇫🇷 Français🇩🇪 Deutsch🇪🇸 Español🇮🇹 Italiano

Real estate price map


Real estate price map in the municipality of Angoulins, choose a section to see transactions by parcel.

Charente-Maritime (17)

Angoulins - Real estate price m²

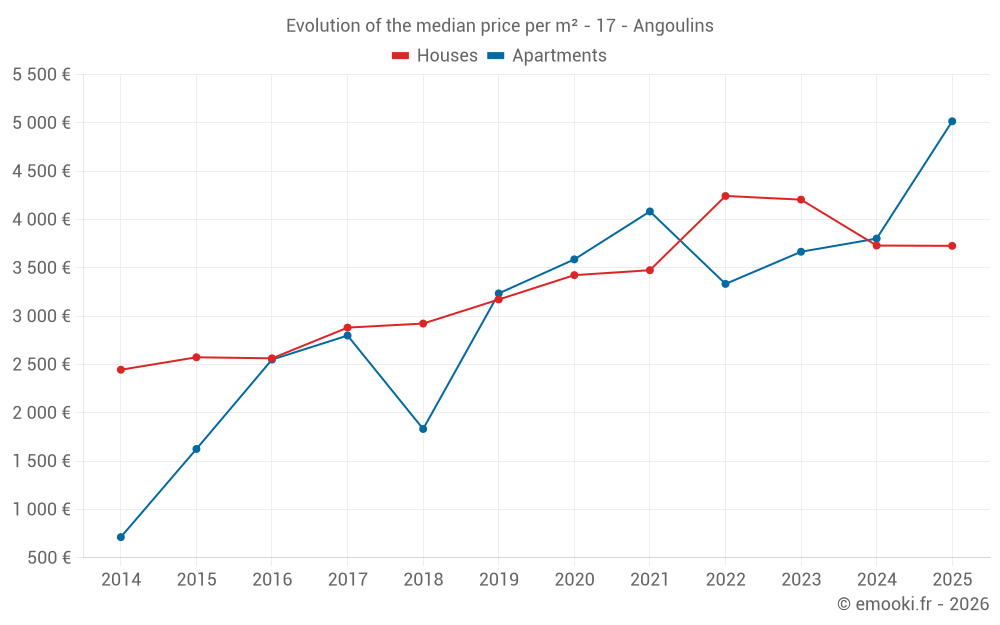
Median price of real estate
in the municipality of Angoulins

HousesHouses
3 728  /m²
1-23-45-67-89-10
Reliability 9/10
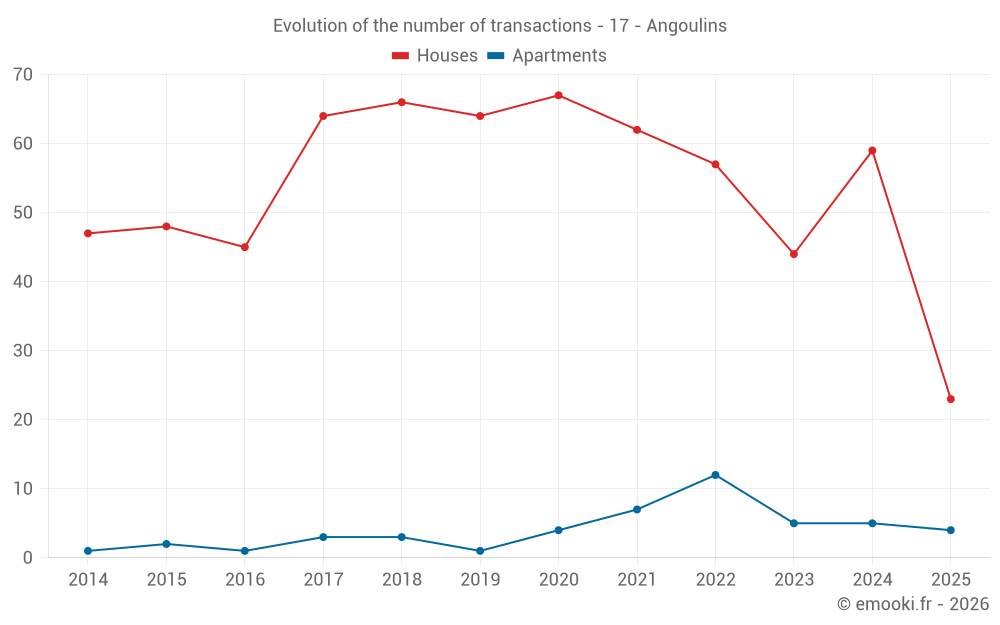
Median price on the 23 transactions of the last 6 months.
from 1 944 to
4 356  /m²
60% of transactions from the 2nd to the 8th deciles.
ApartmentsApartments
3 824  /m²
1-23-45-67-89-10
Reliability 6/10
Median price on the 18 transactions of the last 36 months.
from 3 339 to
4 417  /m²
60% of transactions from the 2nd to the 8th deciles.
DwellingsDwellings
3 947  /m²
1-23-45-67-89-10
Reliability 9/10
Median price on the 27 transactions of the last 6 months.
from 2 071 to
4 666  /m²
60% of transactions from the 2nd to the 8th deciles.
HousesEvolution of the price per m² of houses since...
1 year
-0.1%
2 years
-11%
3 years
-12%
4 years
+7.2%
5 years
+8.8%
6 years
+17%
7 years
+27%
8 years
+29%
9 years
+45%
10 years
+45%
11 years
+52%
The price per m² of houses has decreased by 12% since 3 years, but it has increased by 52% in 11 years.
ApartmentsEvolution of the price per m² of apartments since...
1 year
+32%
2 years
+37%
3 years
+50%
4 years
+23%
5 years
+40%
6 years
--
7 years
--
8 years
--
9 years
--
10 years
--
11 years
--

Yearly evolution

Evolution of the median price per m²

Evolution of the median price per m² - 17 - Angoulins

Evolution of the number of transactions

Warning, last year incomplete. Projections made based on the proportions between semesters of the previous year at the departmental/national level and by type of property.

Evolution of the number of transactions - 17 - Angoulins

Yearly data

Descending order
Year
Houses
house
transactions
Houses
house
Price per m²
Apartments
apt.
transactions
Apartments
apt.
Price per m²
2025
23
3 728 
4
5 017 
2024
59
3 731 
5
3 803 
2023
44
4 206 
5
3 667 
2022
57
4 244 
12
3 334 
2021
62
3 476 
7
4 084 
2020
67
3 425 
4
3 588 
2019
64
3 173 
1
3 236 
2018
66
2 924 
3
1 833 
2017
64
2 882 
3
2 800 
2016
45
2 564 
1
2 551 
2015
48
2 575 
2
1 626 
2014
47
2 446 
1
714 

Analysis

Structure of prices per m²

Values of price percentiles per m² over the periods used for the estimated price of each type of property.

Structure of transaction amounts

Values of transaction amounts percentiles over the periods used for the estimated price of each type of property.

Transaction amounts and prices per m² by percentile

Ascending order
Percentile
Houses
house
Price per m²
Houses
house
Transaction amount
Apartments
apt.
Price per m²
Apartments
apt.
Transaction amount
10th percentile
1 577 
152 K
3 144 
151 K
20th percentile
1 944 
163 K
3 339 
160 K
30th percentile
2 349 
200 K
3 557 
201 K
40th percentile
3 228 
233 K
3 655 
217 K
50th percentile
3 728 
273 K
3 824 
238 K
60th percentile
4 043 
321 K
3 933 
246 K
70th percentile
4 264 
352 K
4 274 
254 K
80th percentile
4 356 
413 K
4 417 
308 K
90th percentile
4 776 
454 K
6 319 
546 K

National and departmental comparison

Evolution of the median price per m² of houses

Evolution of the median price per m² of apartments

Quarterly evolution

Evolution of the median price per m²

Evolution of the number of transactions

Quarterly data

Descending order
Quarter
Houses
house
transactions
Houses
house
Price per m²
Apartments
apt.
transactions
Apartments
apt.
Price per m²
2025 Q2
9
3 190 
0
--- 
2025 Q1
14
4 002 
4
5 017 
2024 Q4
18
3 914 
2
3 866 
2024 Q3
12
3 524 
0
--- 
2024 Q2
15
3 705 
2
3 356 
2024 Q1
14
3 873 
1
4 310 
2023 Q4
7
4 580 
2
5 264 
2023 Q3
11
5 226 
0
--- 
2023 Q2
14
4 233 
1
3 607 
2023 Q1
12
4 058 
2
3 846 
2022 Q4
17
4 594 
1
3 455 
2022 Q3
15
4 535 
3
3 846 
2022 Q2
15
4 015 
3
3 154 
2022 Q1
10
3 599 
5
3 214 
2021 Q4
13
3 500 
3
3 918 
2021 Q3
16
3 751 
2
3 958 
2021 Q2
19
3 072 
1
4 268 
2021 Q1
14
3 156 
1
5 389 
2020 Q4
17
3 590 
1
4 327 
2020 Q3
23
3 333 
2
3 777 
2020 Q2
15
3 296 
1
2 500 
2020 Q1
12
3 608 
0
--- 
2019 Q4
19
3 460 
1
3 236 
2019 Q3
19
3 125 
0
--- 
2019 Q2
14
3 130 
0
--- 
2019 Q1
12
3 116 
0
--- 
2018 Q4
14
2 888 
1
2 236 
2018 Q3
19
3 149 
0
--- 
2018 Q2
17
2 665 
1
1 751 
2018 Q1
16
2 600 
1
1 833 
2017 Q4
19
3 013 
2
2 900 
2017 Q3
23
3 047 
0
--- 
2017 Q2
11
2 463 
0
--- 
2017 Q1
11
2 725 
1
1 944 
2016 Q4
14
2 493 
0
--- 
2016 Q3
13
2 669 
1
2 551 
2016 Q2
10
2 548 
0
--- 
2016 Q1
8
2 622 
0
--- 
2015 Q4
14
2 522 
0
--- 
2015 Q3
17
2 714 
0
--- 
2015 Q2
7
2 254 
1
2 045 
2015 Q1
10
2 530 
1
1 206 
2014 Q4
8
2 852 
0
--- 
2014 Q3
18
2 580 
0
--- 
2014 Q2
10
2 228 
1
714 
2014 Q1
11
2 283 
0
--- 

Overview of the latest real estate transactions

The following list is an anonymized overview of the latest transactions. For more details and to find all transactions, please use the map to view transactions by plot or the transaction search page for a search by criteria.

2025-06-19
319 000 
3 190  /m²(100 m²)
Sale
Houses
House
6 rooms
100 m2
Land
697 m2
-Sols
2025-05-26
15 706 
Sale
Land
10720 m2
-Terres
2025-04-29
157 370 
4 371  /m²(36 m²)
Sale
Houses
House
2 rooms
36 m2
Land
109 m2
-Sols
2025-04-28
380 000 
1 577  /m²(241 m²)
Sale
Houses
House
4 rooms
93 m2
Houses
House
4 rooms
148 m2
2 outbuildings
Land
200 m2
-Sols
2025-04-24
151 200 
1 890  /m²(80 m²)
Sale
Houses
House
3 rooms
80 m2
1 outbuilding
Land
600 m2
-Sols
2025-04-22
160 000 
2 025  /m²(79 m²)
Sale
Houses
House
3 rooms
79 m2
Land
526 m2
-Sols
Land
4 m2
-Sols
2025-04-15
957 000 
4 785  /m²(200 m²)
Sale
Land
117 m2
-Sols
Houses
House
7 rooms
200 m2
2 outbuildings
Land
446 m2
-Sols
2025-04-15
242 300 
3 728  /m²(65 m²)
Sale
Houses
House
2 rooms
65 m2
Land
106 m2
-Sols
2025-04-14
490 000 
4 224  /m²(116 m²)
Sale
Houses
House
5 rooms
116 m2
Land
793 m2
-Sols
2025-04-14
99 000 
Sale
1 outbuilding
Land
52 m2
-Sols
2025-04-04
200 000 
2 410  /m²(83 m²)
Sale
Houses
House
4 rooms
83 m2
Land
533 m2
-Sols
2025-04-03
5 000 
Sale
1 outbuilding
2025-03-31
979 814 
7 049  /m²(139 m²)
Sale
Apartments
Apartment
4 rooms
139 m2
3 outbuildings
2025-03-31
150 000 
3 947  /m²(38 m²)
Sale
Apartments
Apartment
2 rooms
38 m2
2 outbuildings
2025-03-27
420 000 
2 675  /m²(157 m²)
Sale
Apartments
Apartment
2 rooms
26 m2
Apartments
Apartment
1 room
27 m2
Apartments
Apartment
2 rooms
35 m2
Apartments
Apartment
1 room
34 m2
Apartments
Apartment
2 rooms
35 m2
Land
343 m2
-Sols
Land
87 m2
-Sols
Land
7016 m2
-Landes
/Friche
2025-03-26
500 000 
Sale
Land
810 m2
-Terrains à bâtir
Land
18 m2
-Sols
Land
10 m2
-Sols
2025-03-25
455 000 
4 740  /m²(96 m²)
Sale
Houses
House
4 rooms
96 m2
Land
554 m2
-Sols
2025-03-24
216 952 
3 238  /m²(67 m²)
Sale
Houses
House
3 rooms
67 m2
2025-03-20
435 000 
3 991  /m²(109 m²)
Sale
Houses
House
4 rooms
109 m2
Land
667 m2
-Sols
2025-03-14
325 000 
4 012  /m²(81 m²)
Sale
Houses
House
3 rooms
81 m2
Land
398 m2
-Sols
1039 transactions listed in the municipality

Charente-Maritime (17)

Most expensive cities

City
name
Descending orderHouses
house
Price per m²
7 719 
7 366 
6 940 
6 850 
6 566 
City
name
Descending orderApartments
apt.
Price per m²
7 889 
7 613 
7 059 
5 704 

Least expensive cities

City
name
Ascending orderHouses
house
Price per m²
598 
666 
704 
755 
City
name
Ascending orderApartments
apt.
Price per m²
140 
163 
302 
362 
404 
430