emooki
HomePrice mapTransactions
🇬🇧 English🇫🇷 Français🇩🇪 Deutsch🇪🇸 Español🇮🇹 Italiano

Real estate price map


Real estate price map in the municipality of Luc-sur-Mer, choose a section to see transactions by parcel.

Calvados (14)

Luc-sur-Mer - Real estate price m²

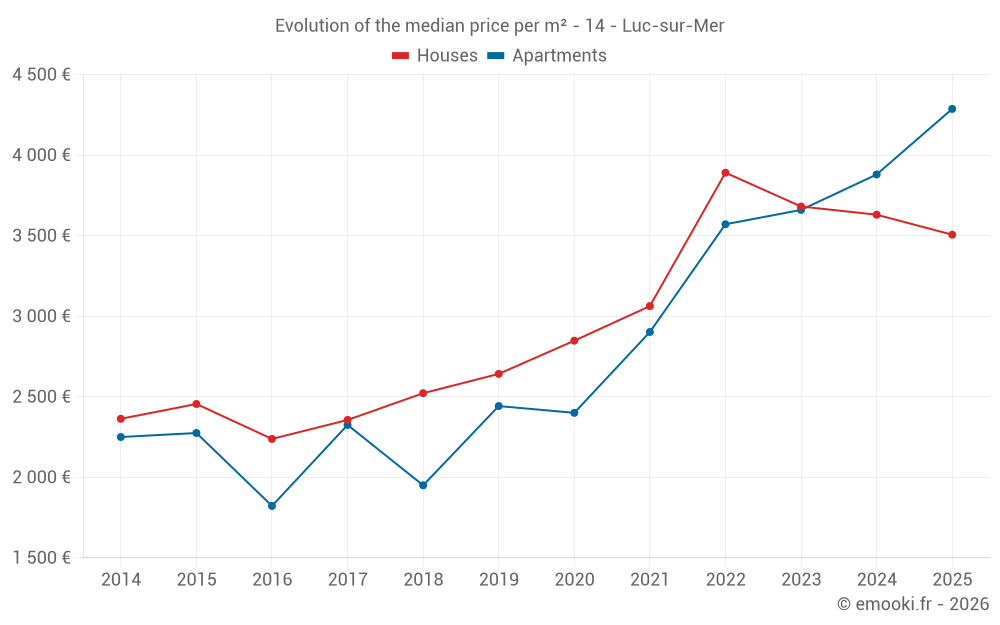
Median price of real estate
in the municipality of Luc-sur-Mer

HousesHouses
3 506  /m²
1-23-45-67-89-10
Reliability 9/10
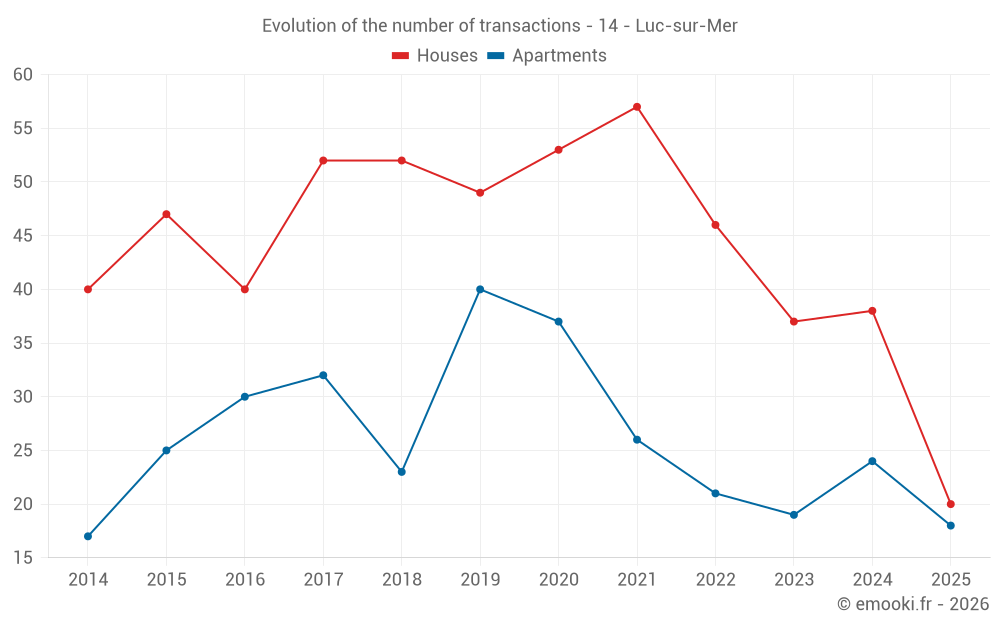
Median price on the 20 transactions of the last 6 months.
from 3 012 to
4 384  /m²
60% of transactions from the 2nd to the 8th deciles.
ApartmentsApartments
4 287  /m²
1-23-45-67-89-10
Reliability 9/10
Median price on the 18 transactions of the last 6 months.
from 2 793 to
5 902  /m²
60% of transactions from the 2nd to the 8th deciles.
DwellingsDwellings
3 754  /m²
1-23-45-67-89-10
Reliability 9/10
Median price on the 38 transactions of the last 6 months.
from 2 809 to
5 623  /m²
60% of transactions from the 2nd to the 8th deciles.
HousesEvolution of the price per m² of houses since...
1 year
-3.4%
2 years
-4.8%
3 years
-10%
4 years
+14%
5 years
+23%
6 years
+33%
7 years
+39%
8 years
+49%
9 years
+57%
10 years
+43%
11 years
+48%
The price per m² of houses has decreased by 10% since 3 years, but it has increased by 57% in 9 years.
ApartmentsEvolution of the price per m² of apartments since...
1 year
+10%
2 years
+17%
3 years
+20%
4 years
+48%
5 years
+79%
6 years
+76%
7 years
+120%
8 years
+84%
9 years
+135%
10 years
+88%
11 years
+91%

Yearly evolution

Evolution of the median price per m²

Evolution of the median price per m² - 14 - Luc-sur-Mer

Evolution of the number of transactions

Warning, last year incomplete. Projections made based on the proportions between semesters of the previous year at the departmental/national level and by type of property.

Evolution of the number of transactions - 14 - Luc-sur-Mer

Yearly data

Descending order
Year
Houses
house
transactions
Houses
house
Price per m²
Apartments
apt.
transactions
Apartments
apt.
Price per m²
2025
20
3 506 
18
4 287 
2024
38
3 630 
24
3 880 
2023
37
3 681 
19
3 660 
2022
46
3 891 
21
3 571 
2021
57
3 063 
26
2 902 
2020
53
2 848 
37
2 400 
2019
49
2 642 
40
2 442 
2018
52
2 522 
23
1 950 
2017
52
2 356 
32
2 325 
2016
40
2 238 
30
1 822 
2015
47
2 455 
25
2 275 
2014
40
2 363 
17
2 250 

Analysis

Structure of prices per m²

Values of price percentiles per m² over the periods used for the estimated price of each type of property.

Structure of transaction amounts

Values of transaction amounts percentiles over the periods used for the estimated price of each type of property.

Transaction amounts and prices per m² by percentile

Ascending order
Percentile
Houses
house
Price per m²
Houses
house
Transaction amount
Apartments
apt.
Price per m²
Apartments
apt.
Transaction amount
10th percentile
2 374 
133 K
2 256 
103 K
20th percentile
3 012 
207 K
2 793 
140 K
30th percentile
3 198 
238 K
2 980 
170 K
40th percentile
3 362 
250 K
3 628 
179 K
50th percentile
3 506 
277 K
4 287 
256 K
60th percentile
3 748 
300 K
5 033 
274 K
70th percentile
4 184 
302 K
5 733 
282 K
80th percentile
4 384 
380 K
5 902 
286 K
90th percentile
5 250 
466 K
5 964 
302 K

National and departmental comparison

Evolution of the median price per m² of houses

Evolution of the median price per m² of apartments

Quarterly evolution

Evolution of the median price per m²

Evolution of the number of transactions

Quarterly data

Descending order
Quarter
Houses
house
transactions
Houses
house
Price per m²
Apartments
apt.
transactions
Apartments
apt.
Price per m²
2025 Q2
8
3 314 
7
3 786 
2025 Q1
12
3 616 
11
4 415 
2024 Q4
10
3 408 
10
3 762 
2024 Q3
14
3 724 
6
3 768 
2024 Q2
9
3 571 
3
3 837 
2024 Q1
5
3 417 
5
3 964 
2023 Q4
12
3 642 
5
4 177 
2023 Q3
12
3 821 
5
3 552 
2023 Q2
6
3 558 
6
3 268 
2023 Q1
7
3 975 
3
4 036 
2022 Q4
17
3 266 
4
2 922 
2022 Q3
10
3 602 
5
3 102 
2022 Q2
11
4 070 
5
3 636 
2022 Q1
8
4 428 
7
3 889 
2021 Q4
11
3 704 
7
3 516 
2021 Q3
7
3 619 
5
2 462 
2021 Q2
20
2 982 
7
2 881 
2021 Q1
19
2 885 
7
2 581 
2020 Q4
25
2 919 
12
2 520 
2020 Q3
7
3 487 
8
1 794 
2020 Q2
10
2 762 
9
2 523 
2020 Q1
11
2 561 
8
2 660 
2019 Q4
13
3 011 
16
2 408 
2019 Q3
17
2 370 
14
2 394 
2019 Q2
10
2 389 
4
3 334 
2019 Q1
9
2 655 
6
2 290 
2018 Q4
16
2 678 
5
2 000 
2018 Q3
16
2 480 
7
1 667 
2018 Q2
15
2 500 
2
1 984 
2018 Q1
5
2 060 
9
2 263 
2017 Q4
10
2 411 
7
1 729 
2017 Q3
12
2 702 
12
2 549 
2017 Q2
15
2 368 
5
2 305 
2017 Q1
15
1 976 
8
1 618 
2016 Q4
9
2 263 
7
1 739 
2016 Q3
10
2 504 
6
2 218 
2016 Q2
10
2 070 
8
1 748 
2016 Q1
11
2 105 
9
1 808 
2015 Q4
16
2 500 
11
2 220 
2015 Q3
5
2 544 
4
2 358 
2015 Q2
14
2 142 
4
2 591 
2015 Q1
12
2 540 
6
2 190 
2014 Q4
9
2 257 
6
1 468 
2014 Q3
15
2 340 
3
2 250 
2014 Q2
5
1 778 
6
2 092 
2014 Q1
11
2 500 
2
2 794 

Overview of the latest real estate transactions

The following list is an anonymized overview of the latest transactions. For more details and to find all transactions, please use the map to view transactions by plot or the transaction search page for a search by criteria.

2025-06-25
256 000 
3 200  /m²(80 m²)
Sale
Houses
House
4 rooms
80 m2
1 outbuilding
Land
117 m2
-Sols
2025-06-16
240 000 
5 581  /m²(43 m²)
Sale
Houses
House
3 rooms
43 m2
Land
223 m2
-Sols
Land
45 m2
-Sols
2025-06-16
172 970 
2 932  /m²(59 m²)
Sale
Apartments
Apartment
3 rooms
59 m2
1 outbuilding
Land
84 m2
-Sols
2025-06-11
104 900 
2 997  /m²(35 m²)
Sale
Apartments
Apartment
2 rooms
35 m2
2 outbuildings
2025-05-27
105 000 
Sale
1 outbuilding
Land
26 m2
-Sols
1 outbuilding
Land
25 m2
-Sols
1 outbuilding
Land
25 m2
-Sols
1 outbuilding
Land
25 m2
-Sols
1 outbuilding
Land
25 m2
-Sols
2025-05-20
610 400 
3 429  /m²(178 m²)
Sale
Houses
House
8 rooms
178 m2
1 outbuilding
Land
331 m2
-Sols
Land
500 m2
-Terrains d'agrément
Land
166 m2
-Sols
2025-05-16
12 500 
174  /m²(72 m²)
Exchange
Apartments
Apartment
6 m2
Apartments
Apartment
2 rooms
30 m2
Apartments
Apartment
6 m2
Apartments
Apartment
2 rooms
30 m2
2025-05-09
402 000 
4 232  /m²(95 m²)
Sale
Houses
House
5 rooms
95 m2
1 outbuilding
Land
836 m2
-Sols
2025-05-02
271 231 
5 651  /m²(48 m²)
Sale
Apartments
Apartment
2 rooms
48 m2
2025-04-30
283 744 
5 911  /m²(48 m²)
Sale
Apartments
Apartment
2 rooms
48 m2
2025-04-29
28 000 
Sale
1 outbuilding
Land
39 m2
-Sols
2025-04-29
27 000 
Sale
1 outbuilding
Land
37 m2
-Sols
2025-04-29
29 000 
Sale
1 outbuilding
Land
44 m2
-Sols
2025-04-28
159 000 
3 786  /m²(42 m²)
Sale
Apartments
Apartment
2 rooms
42 m2
1 outbuilding
2025-04-23
274 000 
2 978  /m²(92 m²)
Sale
Apartments
Apartment
5 rooms
92 m2
2025-04-23
115 000 
3 194  /m²(36 m²)
Sale
Houses
House
1 room
36 m2
Land
30 m2
-Sols
Land
132 m2
-Sols
2025-04-22
32 388 
1 012  /m²(32 m²)
Sale
Houses
House
3 rooms
32 m2
Land
320 m2
-Sols
Land
16194 m2
-Terres
2025-04-18
185 000 
3 083  /m²(60 m²)
Sale
Houses
House
3 rooms
60 m2
Land
21 m2
-Sols
2025-04-17
135 000 
4 500  /m²(30 m²)
Sale
Houses
House
2 rooms
30 m2
Land
40 m2
-Sols
2025-04-09
287 758 
5 995  /m²(48 m²)
Sale
Apartments
Apartment
2 rooms
48 m2
1128 transactions listed in the municipality

Calvados (14)

Most expensive cities

City
name
Descending orderHouses
house
Price per m²
6 297 
5 823 
5 346 
5 102 
5 042 
5 040 
4 875 
City
name
Descending orderApartments
apt.
Price per m²
6 532 
6 000 
5 056 
4 667 
4 332 
4 307 
4 287 

Least expensive cities

City
name
Ascending orderHouses
house
Price per m²
643 
948 
960 
968 
City
name
Ascending orderApartments
apt.
Price per m²
407 
545 
556