emooki
HomePrice mapTransactions
🇬🇧 English🇫🇷 Français🇩🇪 Deutsch🇪🇸 Español🇮🇹 Italiano

Real estate price map


Real estate price map in the municipality of Lion-sur-Mer, choose a section to see transactions by parcel.

Calvados (14)

Lion-sur-Mer - Real estate price m²

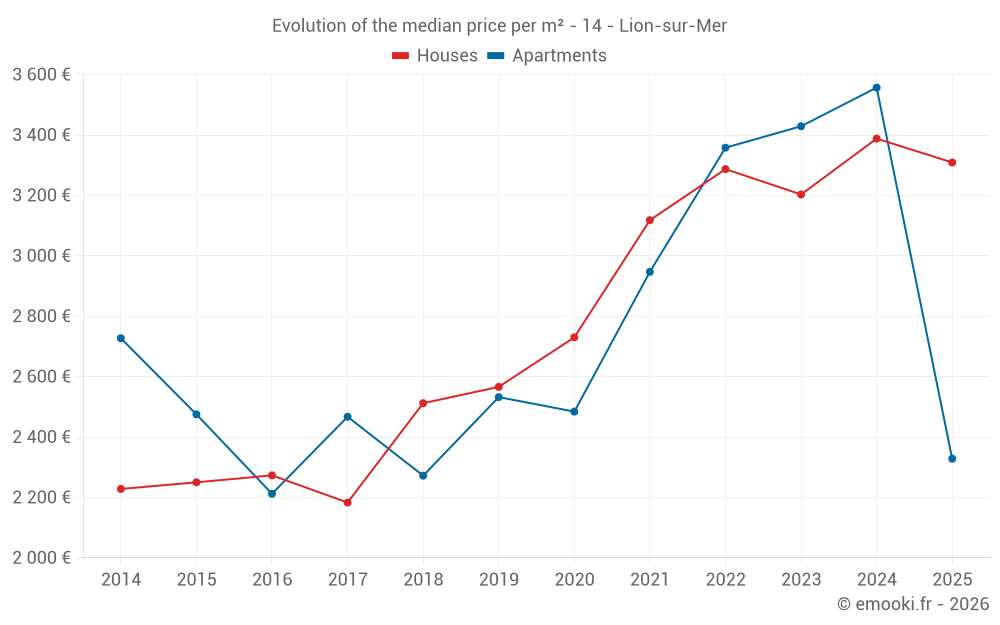
Median price of real estate
in the municipality of Lion-sur-Mer

HousesHouses
3 360  /m²
1-23-45-67-89-10
Reliability 8/10
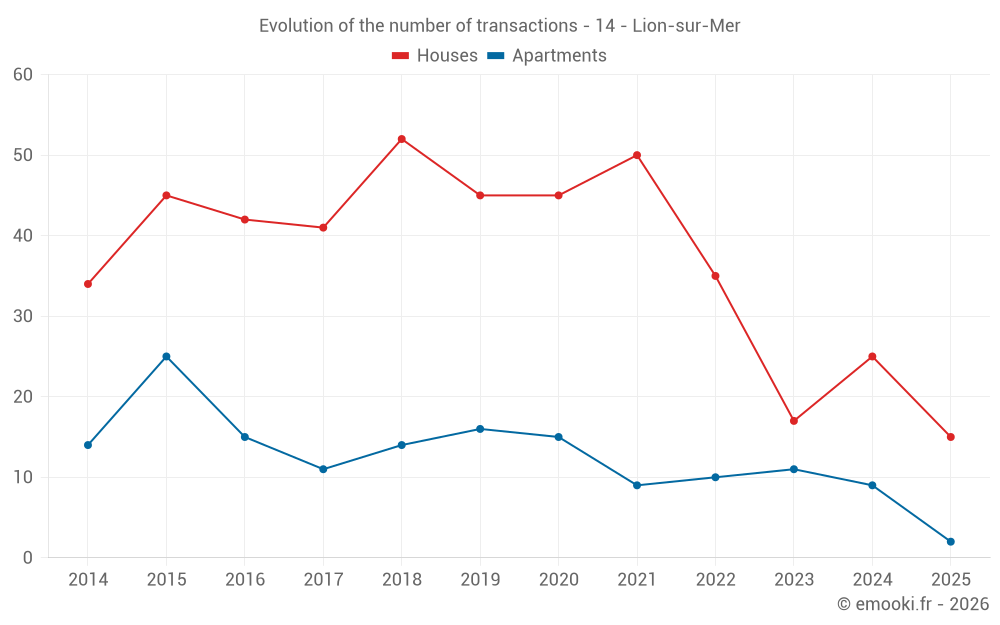
Median price on the 28 transactions of the last 12 months.
from 2 414 to
4 065  /m²
60% of transactions from the 2nd to the 8th deciles.
ApartmentsApartments
3 384  /m²
1-23-45-67-89-10
Reliability 7/10
Median price on the 15 transactions of the last 24 months.
from 1 960 to
3 801  /m²
60% of transactions from the 2nd to the 8th deciles.
DwellingsDwellings
3 358  /m²
1-23-45-67-89-10
Reliability 8/10
Median price on the 34 transactions of the last 12 months.
from 2 374 to
4 033  /m²
60% of transactions from the 2nd to the 8th deciles.
HousesEvolution of the price per m² of houses since...
1 year
-2.3%
2 years
+3.3%
3 years
+0.7%
4 years
+6.1%
5 years
+21%
6 years
+29%
7 years
+32%
8 years
+52%
9 years
+46%
10 years
+47%
11 years
+49%
The price per m² of houses has decreased by 2.3% since 1 year, but it has increased by 52% in 8 years.

Yearly evolution

Evolution of the median price per m²

Evolution of the median price per m² - 14 - Lion-sur-Mer

Evolution of the number of transactions

Warning, last year incomplete. Projections made based on the proportions between semesters of the previous year at the departmental/national level and by type of property.

Evolution of the number of transactions - 14 - Lion-sur-Mer

Yearly data

Descending order
Year
Houses
house
transactions
Houses
house
Price per m²
Apartments
apt.
transactions
Apartments
apt.
Price per m²
2025
15
3 309 
2
2 328 
2024
25
3 388 
9
3 557 
2023
17
3 203 
11
3 429 
2022
35
3 287 
10
3 358 
2021
50
3 118 
9
2 947 
2020
45
2 730 
15
2 484 
2019
45
2 566 
16
2 532 
2018
52
2 512 
14
2 272 
2017
41
2 183 
11
2 467 
2016
42
2 273 
15
2 212 
2015
45
2 250 
25
2 475 
2014
34
2 228 
14
2 727 

Analysis

Structure of prices per m²

Values of price percentiles per m² over the periods used for the estimated price of each type of property.

Structure of transaction amounts

Values of transaction amounts percentiles over the periods used for the estimated price of each type of property.

Transaction amounts and prices per m² by percentile

Ascending order
Percentile
Houses
house
Price per m²
Houses
house
Transaction amount
Apartments
apt.
Price per m²
Apartments
apt.
Transaction amount
10th percentile
2 174 
129 K
1 726 
41 400 
20th percentile
2 414 
169 K
1 960 
84 600 
30th percentile
2 617 
197 K
2 398 
100 K
40th percentile
3 230 
273 K
2 777 
135 K
50th percentile
3 360 
284 K
3 384 
150 K
60th percentile
3 465 
351 K
3 511 
162 K
70th percentile
3 743 
385 K
3 568 
207 K
80th percentile
4 065 
444 K
3 801 
224 K
90th percentile
5 216 
561 K
3 830 
253 K

National and departmental comparison

Evolution of the median price per m² of houses

Evolution of the median price per m² of apartments

Quarterly evolution

Evolution of the median price per m²

Evolution of the number of transactions

Quarterly data

Descending order
Quarter
Houses
house
transactions
Houses
house
Price per m²
Apartments
apt.
transactions
Apartments
apt.
Price per m²
2025 Q2
8
3 248 
1
2 857 
2025 Q1
7
3 309 
1
1 800 
2024 Q4
6
3 744 
3
3 800 
2024 Q3
7
2 571 
1
3 384 
2024 Q2
7
4 159 
2
2 945 
2024 Q1
5
2 038 
3
3 571 
2023 Q4
3
2 315 
4
3 068 
2023 Q3
4
3 870 
0
--- 
2023 Q2
6
3 318 
4
3 336 
2023 Q1
4
2 692 
3
3 429 
2022 Q4
13
2 538 
6
3 510 
2022 Q3
8
3 240 
1
2 471 
2022 Q2
6
2 959 
3
3 264 
2022 Q1
8
3 651 
0
--- 
2021 Q4
12
3 276 
1
3 060 
2021 Q3
14
3 118 
4
3 290 
2021 Q2
17
2 810 
4
2 718 
2021 Q1
7
3 163 
0
--- 
2020 Q4
19
2 784 
7
2 484 
2020 Q3
12
2 746 
2
2 418 
2020 Q2
6
2 716 
4
2 080 
2020 Q1
8
2 086 
2
2 888 
2019 Q4
15
2 532 
5
2 718 
2019 Q3
12
2 347 
6
2 871 
2019 Q2
9
2 800 
2
1 751 
2019 Q1
9
2 857 
3
1 576 
2018 Q4
17
2 310 
3
2 627 
2018 Q3
8
2 885 
3
2 023 
2018 Q2
19
2 528 
4
1 660 
2018 Q1
8
2 223 
4
2 336 
2017 Q4
14
2 278 
3
1 429 
2017 Q3
4
1 973 
2
3 122 
2017 Q2
14
2 055 
2
2 662 
2017 Q1
9
2 492 
4
2 217 
2016 Q4
17
2 273 
1
2 095 
2016 Q3
8
2 303 
2
2 190 
2016 Q2
8
2 281 
8
2 166 
2016 Q1
9
1 934 
4
2 666 
2015 Q4
11
2 571 
8
2 673 
2015 Q3
14
2 264 
12
2 426 
2015 Q2
10
2 316 
2
3 072 
2015 Q1
10
2 080 
3
1 949 
2014 Q4
11
2 181 
4
2 630 
2014 Q3
11
2 378 
3
2 662 
2014 Q2
5
1 947 
3
3 704 
2014 Q1
7
2 213 
4
2 305 

Overview of the latest real estate transactions

The following list is an anonymized overview of the latest transactions. For more details and to find all transactions, please use the map to view transactions by plot or the transaction search page for a search by criteria.

2025-06-30
153 000 
Sale
1 outbuilding
2025-06-10
343 000 
2 415  /m²(142 m²)
Sale
Houses
House
5 rooms
142 m2
Land
601 m2
-Sols
2025-05-23
280 000 
4 667  /m²(60 m²)
Sale
Houses
House
3 rooms
60 m2
Land
620 m2
-Sols
2025-05-13
74 100 
1 453  /m²(51 m²)
Sale
Houses
House
3 rooms
51 m2
Land
20 m2
-Sols
Land
227 m2
-Sols
2025-04-30
195 000 
3 545  /m²(55 m²)
Sale
Houses
House
4 rooms
55 m2
Land
33 m2
-Sols
1 outbuilding
1 outbuilding
Land
2 m2
-Sols
Land
36 m2
-Jardins
2025-04-29
397 370 
3 104  /m²(128 m²)
Sale
Houses
House
6 rooms
128 m2
Land
778 m2
-Sols
Land
51 m2
-Sols
2025-04-29
130 000 
2 281  /m²(57 m²)
Sale
Houses
House
3 rooms
57 m2
Land
51 m2
-Sols
2025-04-29
472 000 
3 445  /m²(137 m²)
Sale
Houses
House
5 rooms
137 m2
Land
800 m2
-Sols
Land
417 m2
-Terrains d'agrément
2025-04-25
120 000 
2 857  /m²(42 m²)
Sale
Apartments
Apartment
2 rooms
42 m2
1 outbuilding
2025-04-22
32 388 
1 012  /m²(32 m²)
Sale
Houses
House
3 rooms
32 m2
Land
320 m2
-Sols
Land
16194 m2
-Terres
2025-04-18
5 681 
Sale
Land
3787 m2
-Terres
2025-04-09
471 600 
3 393  /m²(139 m²)
Sale
Houses
House
5 rooms
109 m2
Houses
House
1 room
30 m2
Land
246 m2
-Sols
2025-04-08
45 000 
Sale
1 outbuilding
2025-03-28
877 000 
6 496  /m²(135 m²)
Sale
Houses
House
4 rooms
135 m2
1 outbuilding
Land
680 m2
-Sols
2025-03-26
268 000 
3 309  /m²(81 m²)
Sale
Houses
House
5 rooms
81 m2
Land
738 m2
-Sols
2025-03-14
99 970 
1 562  /m²(64 m²)
Sale
Houses
House
3 rooms
64 m2
Land
296 m2
-Sols
2025-03-05
22 000 
Sale
Land
1753 m2
-Terres
Land
3866 m2
-Terres
Land
3651 m2
-Terres
Land
1610 m2
-Terres
2025-02-24
162 000 
2 314  /m²(70 m²)
Sale
Houses
House
5 rooms
70 m2
2 outbuildings
2025-02-20
444 500 
3 969  /m²(112 m²)
Sale
Houses
House
5 rooms
112 m2
Land
528 m2
-Sols
2025-02-20
27 000 
1 800  /m²(15 m²)
Sale
Apartments
Apartment
1 room
15 m2
853 transactions listed in the municipality

Calvados (14)

Most expensive cities

City
name
Descending orderHouses
house
Price per m²
6 297 
5 823 
5 346 
5 102 
5 042 
5 040 
4 875 
City
name
Descending orderApartments
apt.
Price per m²
6 532 
6 000 
5 056 
4 667 
4 332 
4 307 
4 287 

Least expensive cities

City
name
Ascending orderHouses
house
Price per m²
643 
948 
960 
968 
City
name
Ascending orderApartments
apt.
Price per m²
407 
545 
556