emooki
HomePrice mapTransactions
🇬🇧 English🇫🇷 Français🇩🇪 Deutsch🇪🇸 Español🇮🇹 Italiano

Real estate price map


Real estate price map in the municipality of Hermanville-sur-Mer, choose a section to see transactions by parcel.

Calvados (14)

Hermanville-sur-Mer - Real estate price m²

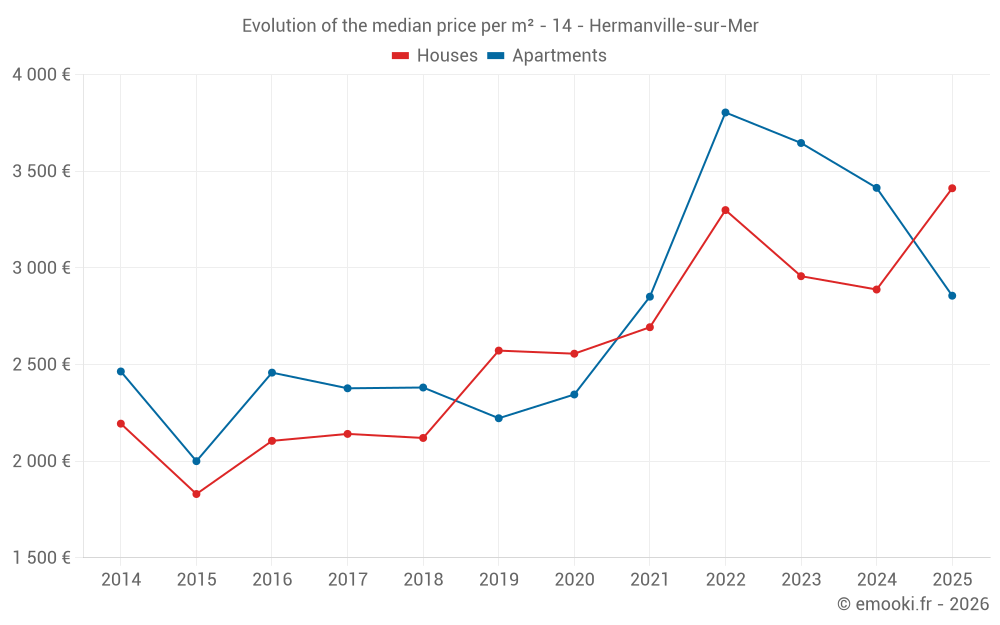
Median price of real estate
in the municipality of Hermanville-sur-Mer

HousesHouses
3 275  /m²
1-23-45-67-89-10
Reliability 8/10
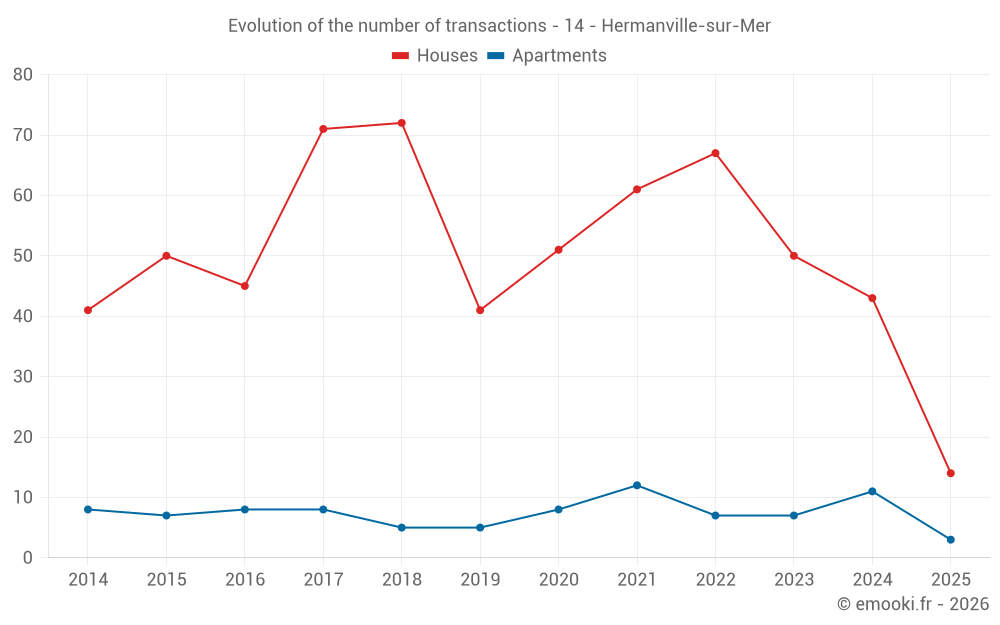
Median price on the 36 transactions of the last 12 months.
from 2 477 to
4 425  /m²
60% of transactions from the 2nd to the 8th deciles.
ApartmentsApartments
3 158  /m²
1-23-45-67-89-10
Reliability 7/10
Median price on the 17 transactions of the last 24 months.
from 2 867 to
4 248  /m²
60% of transactions from the 2nd to the 8th deciles.
DwellingsDwellings
3 275  /m²
1-23-45-67-89-10
Reliability 8/10
Median price on the 44 transactions of the last 12 months.
from 2 432 to
4 536  /m²
60% of transactions from the 2nd to the 8th deciles.
HousesEvolution of the price per m² of houses since...
1 year
+18%
2 years
+15%
3 years
+3.4%
4 years
+27%
5 years
+33%
6 years
+33%
7 years
+61%
8 years
+59%
9 years
+62%
10 years
+86%
11 years
+56%

Yearly evolution

Evolution of the median price per m²

Evolution of the median price per m² - 14 - Hermanville-sur-Mer

Evolution of the number of transactions

Warning, last year incomplete. Projections made based on the proportions between semesters of the previous year at the departmental/national level and by type of property.

Evolution of the number of transactions - 14 - Hermanville-sur-Mer

Yearly data

Descending order
Year
Houses
house
transactions
Houses
house
Price per m²
Apartments
apt.
transactions
Apartments
apt.
Price per m²
2025
14
3 412 
3
2 856 
2024
43
2 888 
11
3 414 
2023
50
2 957 
7
3 646 
2022
67
3 299 
7
3 804 
2021
61
2 693 
12
2 851 
2020
51
2 556 
8
2 345 
2019
41
2 572 
5
2 222 
2018
72
2 120 
5
2 381 
2017
71
2 141 
8
2 377 
2016
45
2 105 
8
2 458 
2015
50
1 830 
7
2 000 
2014
41
2 194 
8
2 464 

Analysis

Structure of prices per m²

Values of price percentiles per m² over the periods used for the estimated price of each type of property.

Structure of transaction amounts

Values of transaction amounts percentiles over the periods used for the estimated price of each type of property.

Transaction amounts and prices per m² by percentile

Ascending order
Percentile
Houses
house
Price per m²
Houses
house
Transaction amount
Apartments
apt.
Price per m²
Apartments
apt.
Transaction amount
10th percentile
2 004 
90 000 
2 206 
100 K
20th percentile
2 477 
146 K
2 867 
120 K
30th percentile
2 684 
173 K
2 913 
121 K
40th percentile
3 049 
245 K
2 997 
146 K
50th percentile
3 275 
267 K
3 158 
163 K
60th percentile
3 386 
287 K
3 392 
175 K
70th percentile
3 620 
332 K
3 748 
186 K
80th percentile
4 425 
404 K
4 248 
217 K
90th percentile
5 315 
496 K
4 756 
345 K

National and departmental comparison

Evolution of the median price per m² of houses

Evolution of the median price per m² of apartments

Quarterly evolution

Evolution of the median price per m²

Evolution of the number of transactions

Quarterly data

Descending order
Quarter
Houses
house
transactions
Houses
house
Price per m²
Apartments
apt.
transactions
Apartments
apt.
Price per m²
2025 Q2
8
3 432 
1
2 856 
2025 Q1
6
3 358 
2
2 663 
2024 Q4
15
3 281 
0
--- 
2024 Q3
7
3 205 
5
4 667 
2024 Q2
11
2 174 
4
3 419 
2024 Q1
10
3 120 
2
3 164 
2023 Q4
11
2 955 
2
3 378 
2023 Q3
15
3 641 
1
967 
2023 Q2
10
2 980 
3
3 646 
2023 Q1
14
2 590 
1
3 674 
2022 Q4
11
3 389 
1
3 804 
2022 Q3
24
3 390 
1
4 595 
2022 Q2
15
3 043 
4
3 826 
2022 Q1
17
3 000 
1
2 146 
2021 Q4
15
2 927 
2
1 270 
2021 Q3
15
2 428 
3
3 647 
2021 Q2
19
2 778 
4
2 851 
2021 Q1
12
2 682 
3
2 368 
2020 Q4
12
2 372 
2
2 512 
2020 Q3
16
2 487 
2
1 912 
2020 Q2
10
2 593 
1
2 022 
2020 Q1
13
2 816 
3
2 852 
2019 Q4
12
2 384 
1
1 913 
2019 Q3
11
2 929 
2
2 352 
2019 Q2
11
2 154 
1
2 347 
2019 Q1
7
2 857 
1
1 579 
2018 Q4
23
2 136 
0
--- 
2018 Q3
15
2 171 
2
2 154 
2018 Q2
16
1 943 
1
1 544 
2018 Q1
18
2 308 
2
2 414 
2017 Q4
15
1 935 
1
1 889 
2017 Q3
24
2 392 
3
2 830 
2017 Q2
15
1 922 
2
2 377 
2017 Q1
17
1 778 
2
2 787 
2016 Q4
17
1 923 
2
2 434 
2016 Q3
10
2 571 
2
2 896 
2016 Q2
6
2 129 
3
2 308 
2016 Q1
12
2 435 
1
2 041 
2015 Q4
13
1 691 
2
1 912 
2015 Q3
16
1 662 
1
2 143 
2015 Q2
14
2 200 
2
1 958 
2015 Q1
7
1 924 
2
2 161 
2014 Q4
8
2 282 
5
2 306 
2014 Q3
12
2 110 
3
2 621 
2014 Q2
8
2 518 
0
--- 
2014 Q1
13
2 179 
0
--- 

Overview of the latest real estate transactions

The following list is an anonymized overview of the latest transactions. For more details and to find all transactions, please use the map to view transactions by plot or the transaction search page for a search by criteria.

2025-06-13
106 000 
Sale
Land
386 m2
-Terrains à bâtir
2025-06-05
210 000 
3 333  /m²(63 m²)
Sale
Land
56 m2
-Sols
Land
115 m2
-Sols
Houses
House
4 rooms
63 m2
Land
104 m2
-Sols
2025-06-03
442 000 
5 525  /m²(80 m²)
Sale
Houses
House
4 rooms
80 m2
Land
442 m2
-Sols
2025-05-09
330 000 
2 750  /m²(120 m²)
4 231  /m²(78 m²)
Sale
Houses
House
5 rooms
78 m2
Commercial property
42 m2
Land
1044 m2
-Sols
Land
1168 m2
-Prés
2025-05-02
96 500 
Sale
Land
444 m2
-Terrains à bâtir
2025-04-30
73 000 
2 517  /m²(29 m²)
Sale
Houses
House
3 rooms
29 m2
1 outbuilding
Land
307 m2
-Sols
2025-04-29
749 000 
6 242  /m²(120 m²)
Sale
Houses
House
6 rooms
120 m2
Land
585 m2
-Sols
Land
85 m2
-Sols
2025-04-25
305 000 
Sale
Land
309 m2
-Terrains à bâtir
2025-04-25
276 000 
2 760  /m²(100 m²)
Sale
Houses
House
6 rooms
100 m2
Land
508 m2
-Sols
2025-04-23
125 000 
Sale
Land
436 m2
-Terrains à bâtir
Land
56 m2
-Terrains à bâtir
2025-04-23
286 000 
3 531  /m²(81 m²)
Sale
Houses
House
4 rooms
81 m2
Land
856 m2
-Sols
2025-04-22
403 900 
3 847  /m²(105 m²)
Sale
Houses
House
6 rooms
105 m2
Land
363 m2
-Sols
2025-04-18
352 540 
2 350  /m²(150 m²)
Sale
Houses
House
6 rooms
150 m2
Land
622 m2
-Sols
2025-04-08
188 500 
2 856  /m²(66 m²)
Sale
Apartments
Apartment
3 rooms
66 m2
1 outbuilding
1 outbuilding
2025-04-01
108 000 
Sale
Land
192 m2
-Terrains à bâtir
Land
208 m2
-Terrains à bâtir
2025-03-28
384 000 
3 491  /m²(110 m²)
Sale
Houses
House
5 rooms
110 m2
Land
449 m2
-Sols
2025-03-28
204 200 
5 105  /m²(40 m²)
Sale
Houses
House
4 rooms
40 m2
2025-03-27
140 000 
Sale
Land
153 m2
-Sols
2025-03-25
72 000 
Sale
Land
308 m2
-Terrains à bâtir
2025-03-18
155 000 
Sale
Land
707 m2
-Terrains à bâtir
1024 transactions listed in the municipality

Calvados (14)

Most expensive cities

City
name
Descending orderHouses
house
Price per m²
6 297 
5 823 
5 346 
5 102 
5 042 
5 040 
4 875 
City
name
Descending orderApartments
apt.
Price per m²
6 532 
6 000 
5 056 
4 667 
4 332 
4 307 
4 287 

Least expensive cities

City
name
Ascending orderHouses
house
Price per m²
643 
948 
960 
968 
City
name
Ascending orderApartments
apt.
Price per m²
407 
545 
556