emooki

Real estate price map


Real estate price map in the municipality of Manosque, choose a section to see transactions by parcel.

Alpes-de-Haute-Provence (04)

Price per m² in Manosque

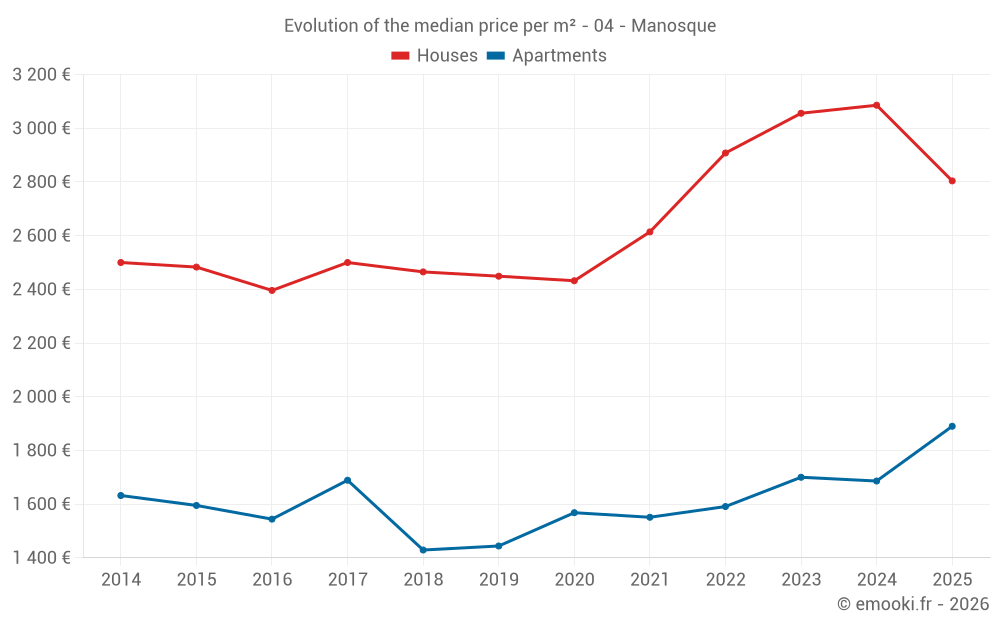
Median price of real estate
in the municipality of Manosque

HousesHouses
2 804  /m²
1-23-45-67-89-10
Reliability 9/10
Median price on the 25 transactions of the last 6 months.
from 2 277 to
3 165  /m²
60% of transactions from the 2nd to the 8th deciles.
ApartmentsApartments
1 890  /m²
1-23-45-67-89-10
Reliability 9/10
Median price on the 72 transactions of the last 6 months.
from 1 376 to
2 379  /m²
60% of transactions from the 2nd to the 8th deciles.
DwellingsDwellings
1 915  /m²
1-23-45-67-89-10
Reliability 10/10
Median price on the 21 transactions of the last 3 months.
from 1 507 to
2 609  /m²
60% of transactions from the 2nd to the 8th deciles.
HousesEvolution of the price per m² of houses since...
1 year
-9.1%
2 years
-8.2%
3 years
-3.6%
4 years
+7.3%
5 years
+15%
6 years
+14%
7 years
+14%
8 years
+12%
9 years
+17%
10 years
+13%
11 years
+12%
The price per m² of houses has decreased by 9.1% since 1 year, but it has increased by 17% in 9 years.
ApartmentsEvolution of the price per m² of apartments since...
1 year
+12%
2 years
+11%
3 years
+19%
4 years
+22%
5 years
+21%
6 years
+31%
7 years
+32%
8 years
+12%
9 years
+22%
10 years
+18%
11 years
+16%

5382 transactions listed in the municipality

Yearly data

Yearly evolution of the median price per m²

Yearly evolution of the median price per m² - 04 - Manosque

Yearly evolution of the number of transactions

Warning, last year incomplete. Projections made based on the proportions between semesters of the previous year at the departmental/national level and by type of property.

Yearly evolution of the number of transactions - 04 - Manosque

Yearly table

Descending order
Year
Houses
house
transactions
Houses
house
Price per m²
Apartments
apt.
transactions
Apartments
apt.
Price per m²
2025
25
2 804 
72
1 890 
2024
83
3 086 
197
1 686 
2023
119
3 056 
237
1 700 
2022
152
2 908 
303
1 591 
2021
160
2 614 
279
1 551 
2020
128
2 432 
197
1 568 
2019
123
2 449 
212
1 444 
2018
122
2 465 
173
1 429 
2017
120
2 500 
171
1 689 
2016
90
2 396 
164
1 544 
2015
85
2 483 
145
1 595 
2014
77
2 500 
144
1 632 

Analysis

Structure of prices per m²

Values of price percentiles per m² over the periods used for the estimated price of each type of property.

Structure of transaction amounts

Values of transaction amounts percentiles over the periods used for the estimated price of each type of property.

Transaction amounts and prices per m² by percentile

Ascending order
Percentile
Houses
house
Price per m²
Houses
house
Transaction amount
Apartments
apt.
Price per m²
Apartments
apt.
Transaction amount
10th percentile
2 035 
149 K
1 203 
70 000 
20th percentile
2 277 
199 K
1 376 
87 696 
30th percentile
2 369 
230 K
1 531 
96 200 
40th percentile
2 561 
238 K
1 715 
114 K
50th percentile
2 804 
257 K
1 890 
123 K
60th percentile
2 945 
273 K
2 018 
141 K
70th percentile
3 052 
294 K
2 130 
151 K
80th percentile
3 165 
359 K
2 379 
177 K
90th percentile
3 381 
407 K
2 800 
205 K

National and departmental comparison

Evolution of the median price per m² of houses

Evolution of the median price per m² of apartments

Quarterly data

Quarterly evolution of the median price per m²

Quarterly evolution of the number of transactions

Quarterly table

Descending order
Quarter
Houses
house
transactions
Houses
house
Price per m²
Apartments
apt.
transactions
Apartments
apt.
Price per m²
2025 Q2
4
2 921 
17
1 722 
2025 Q1
21
2 804 
55
1 908 
2024 Q4
26
2 942 
56
1 717 
2024 Q3
30
3 207 
36
1 534 
2024 Q2
15
2 639 
57
1 677 
2024 Q1
12
3 130 
48
1 704 
2023 Q4
39
3 279 
61
1 700 
2023 Q3
23
2 792 
56
1 695 
2023 Q2
30
3 094 
58
1 792 
2023 Q1
27
2 678 
62
1 594 
2022 Q4
36
2 658 
64
1 612 
2022 Q3
51
3 099 
89
1 710 
2022 Q2
33
2 974 
80
1 564 
2022 Q1
32
2 628 
70
1 527 
2021 Q4
46
2 717 
83
1 569 
2021 Q3
46
2 612 
78
1 516 
2021 Q2
39
2 634 
69
1 524 
2021 Q1
29
2 326 
49
1 597 
2020 Q4
45
2 247 
67
1 485 
2020 Q3
28
2 434 
40
1 690 
2020 Q2
32
2 439 
42
1 782 
2020 Q1
23
2 561 
48
1 452 
2019 Q4
28
2 535 
56
1 482 
2019 Q3
36
2 477 
60
1 594 
2019 Q2
38
2 325 
55
1 348 
2019 Q1
21
2 629 
41
1 318 
2018 Q4
34
2 606 
45
1 429 
2018 Q3
36
2 466 
49
1 573 
2018 Q2
31
2 372 
38
1 412 
2018 Q1
21
2 460 
41
1 318 
2017 Q4
35
2 683 
26
1 780 
2017 Q3
25
2 269 
50
1 700 
2017 Q2
37
2 657 
53
1 563 
2017 Q1
23
2 500 
42
1 666 
2016 Q4
20
2 442 
38
1 488 
2016 Q3
29
2 468 
48
1 658 
2016 Q2
15
2 312 
46
1 538 
2016 Q1
26
2 224 
32
1 534 
2015 Q4
26
2 509 
38
1 682 
2015 Q3
16
2 434 
43
1 558 
2015 Q2
20
2 432 
34
1 467 
2015 Q1
23
2 500 
30
1 581 
2014 Q4
13
2 546 
40
1 812 
2014 Q3
25
2 500 
38
1 468 
2014 Q2
19
2 500 
31
1 690 
2014 Q1
20
2 278 
35
1 520 

Key takeaways

  • QuestionWhat is the price per m2 of houses in Manosque?

    The median price on the 25 house transactions of the last 6 months in the municipality of Manosque was 2 804 € per square meter for a median property value of 256 670 €. Over this period, 60% of transactions were between 2 277 and 3 165 € per square meter (from the 2nd to the 8th deciles).

  • QuestionWhat is the price per m2 of apartments in Manosque?

    The median price on the 72 apartment transactions of the last 6 months in the municipality of Manosque was 1 890 € per square meter for a median property value of 123 300 €. Over this period, 60% of transactions were between 1 376 and 2 379 € per square meter (from the 2nd to the 8th deciles).

Compare with neighboring municipalities

City
name
Descending orderHouses
house
Price per m²
Apartments
apt.
Price per m²
3 144 
1 948 
2 928 
1 826 
2 804 
1 890 
2 667 
1 957 
2 519 
2 130 
2 450 
2 129 
2 346 
900 
2 333 
1 515 
1 941 
2 001 
1 588 
--- 

City information

Zip code

  • 04100 MANOSQUE