emooki
HomePrice mapTransactions
🇬🇧 English🇫🇷 Français🇩🇪 Deutsch🇪🇸 Español🇮🇹 Italiano

Real estate price map


Real estate price map in the municipality of Forcalquier, choose a section to see transactions by parcel.

Alpes-de-Haute-Provence (04)

Forcalquier - Real estate price m²

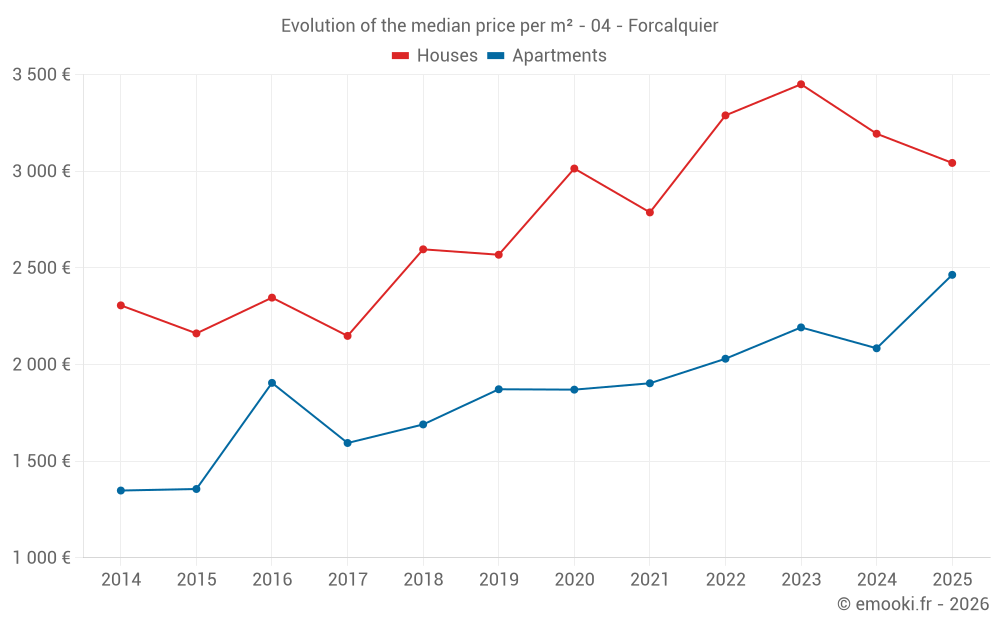
Median price of real estate
in the municipality of Forcalquier

HousesHouses
3 174  /m²
1-23-45-67-89-10
Reliability 8/10
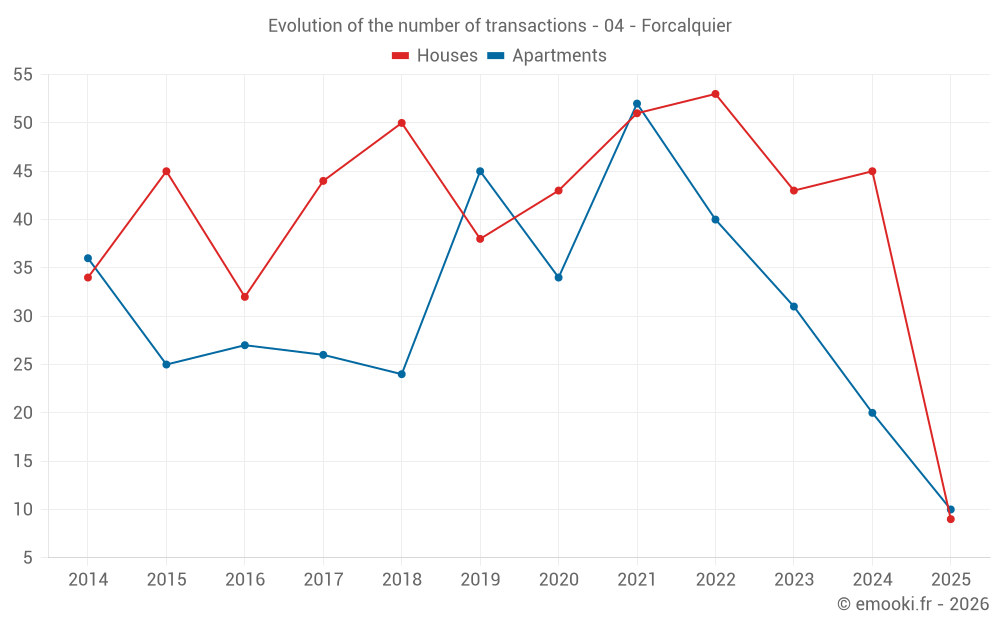
Median price on the 39 transactions of the last 12 months.
from 2 443 to
3 775  /m²
60% of transactions from the 2nd to the 8th deciles.
ApartmentsApartments
2 302  /m²
1-23-45-67-89-10
Reliability 8/10
Median price on the 22 transactions of the last 12 months.
from 1 902 to
2 638  /m²
60% of transactions from the 2nd to the 8th deciles.
DwellingsDwellings
2 641  /m²
1-23-45-67-89-10
Reliability 9/10
Median price on the 19 transactions of the last 6 months.
from 2 274 to
3 169  /m²
60% of transactions from the 2nd to the 8th deciles.
HousesEvolution of the price per m² of houses since...
1 year
-4.7%
2 years
-12%
3 years
-7.5%
4 years
+9.2%
5 years
+1%
6 years
+18%
7 years
+17%
8 years
+42%
9 years
+30%
10 years
+41%
11 years
+32%
The price per m² of houses has decreased by 12% since 2 years, but it has increased by 42% in 8 years.
ApartmentsEvolution of the price per m² of apartments since...
1 year
+18%
2 years
+12%
3 years
+21%
4 years
+29%
5 years
+32%
6 years
+32%
7 years
+46%
8 years
+55%
9 years
+29%
10 years
+82%
11 years
+83%

Yearly evolution

Evolution of the median price per m²

Evolution of the median price per m² - 04 - Forcalquier

Evolution of the number of transactions

Warning, last year incomplete. Projections made based on the proportions between semesters of the previous year at the departmental/national level and by type of property.

Evolution of the number of transactions - 04 - Forcalquier

Yearly data

Descending order
Year
Houses
house
transactions
Houses
house
Price per m²
Apartments
apt.
transactions
Apartments
apt.
Price per m²
2025
9
3 043 
10
2 464 
2024
45
3 194 
20
2 084 
2023
43
3 450 
31
2 192 
2022
53
3 289 
40
2 030 
2021
51
2 787 
52
1 903 
2020
43
3 014 
34
1 870 
2019
38
2 568 
45
1 872 
2018
50
2 596 
24
1 690 
2017
44
2 148 
26
1 594 
2016
32
2 346 
27
1 905 
2015
45
2 161 
25
1 356 
2014
34
2 306 
36
1 348 

Analysis

Structure of prices per m²

Values of price percentiles per m² over the periods used for the estimated price of each type of property.

Structure of transaction amounts

Values of transaction amounts percentiles over the periods used for the estimated price of each type of property.

Transaction amounts and prices per m² by percentile

Ascending order
Percentile
Houses
house
Price per m²
Houses
house
Transaction amount
Apartments
apt.
Price per m²
Apartments
apt.
Transaction amount
10th percentile
1 829 
171 K
1 532 
85 300 
20th percentile
2 443 
218 K
1 902 
110 K
30th percentile
2 802 
261 K
2 047 
120 K
40th percentile
2 899 
273 K
2 220 
134 K
50th percentile
3 174 
304 K
2 302 
141 K
60th percentile
3 213 
333 K
2 337 
148 K
70th percentile
3 410 
353 K
2 562 
171 K
80th percentile
3 775 
370 K
2 638 
196 K
90th percentile
4 041 
420 K
3 466 
315 K

National and departmental comparison

Evolution of the median price per m² of houses

Evolution of the median price per m² of apartments

Quarterly evolution

Evolution of the median price per m²

Evolution of the number of transactions

Quarterly data

Descending order
Quarter
Houses
house
transactions
Houses
house
Price per m²
Apartments
apt.
transactions
Apartments
apt.
Price per m²
2025 Q2
4
2 540 
4
2 460 
2025 Q1
5
3 179 
6
2 482 
2024 Q4
17
3 174 
7
2 101 
2024 Q3
13
3 270 
5
2 024 
2024 Q2
8
3 250 
3
2 636 
2024 Q1
7
3 182 
5
1 938 
2023 Q4
10
3 420 
9
2 143 
2023 Q3
13
3 955 
8
2 588 
2023 Q2
9
3 434 
8
2 180 
2023 Q1
11
2 974 
6
1 844 
2022 Q4
16
3 368 
12
2 228 
2022 Q3
14
3 306 
13
1 818 
2022 Q2
5
3 675 
8
2 276 
2022 Q1
18
2 970 
7
1 860 
2021 Q4
15
2 581 
18
2 208 
2021 Q3
12
2 961 
15
1 690 
2021 Q2
14
2 876 
8
1 586 
2021 Q1
10
2 166 
11
1 901 
2020 Q4
12
3 072 
8
1 526 
2020 Q3
14
2 862 
5
1 633 
2020 Q2
10
2 506 
11
1 767 
2020 Q1
7
3 026 
10
2 156 
2019 Q4
8
2 292 
13
2 037 
2019 Q3
15
2 800 
7
2 059 
2019 Q2
10
2 569 
10
1 818 
2019 Q1
5
2 382 
15
1 504 
2018 Q4
9
3 101 
5
1 781 
2018 Q3
14
2 502 
5
1 429 
2018 Q2
12
2 280 
5
1 717 
2018 Q1
15
2 629 
9
1 829 
2017 Q4
10
2 130 
5
1 642 
2017 Q3
11
2 520 
9
1 456 
2017 Q2
10
2 170 
6
1 680 
2017 Q1
13
2 056 
6
1 312 
2016 Q4
6
1 786 
5
2 271 
2016 Q3
12
2 250 
5
1 250 
2016 Q2
7
2 406 
9
2 024 
2016 Q1
7
2 544 
8
1 181 
2015 Q4
14
2 554 
5
1 488 
2015 Q3
12
2 190 
7
1 141 
2015 Q2
10
1 964 
7
1 123 
2015 Q1
9
1 447 
6
1 992 
2014 Q4
14
2 078 
8
1 226 
2014 Q3
8
2 426 
8
1 077 
2014 Q2
8
2 734 
8
1 628 
2014 Q1
4
2 315 
12
1 658 

Overview of the latest real estate transactions

The following list is an anonymized overview of the latest transactions. For more details and to find all transactions, please use the map to view transactions by plot or the transaction search page for a search by criteria.

2025-06-20
120 000 
Sale
Land
9 m2
-Terrains d'agrément
/Parc
Land
871 m2
-Terrains d'agrément
/Parc
2025-05-28
88 000 
2 588  /m²(34 m²)
Sale
Apartments
Apartment
2 rooms
34 m2
2025-05-28
185 950 
2 240  /m²(83 m²)
Sale
Houses
House
4 rooms
83 m2
Land
20 m2
-Sols
Land
25 m2
-Sols
2025-05-26
150 550 
2 641  /m²(57 m²)
Sale
Apartments
Apartment
3 rooms
57 m2
1 outbuilding
2025-05-21
250 000 
2 841  /m²(88 m²)
Sale
Houses
House
4 rooms
88 m2
1 outbuilding
Land
730 m2
-Sols
2025-04-18
40 000 
625  /m²(64 m²)
Sale
Houses
House
4 rooms
64 m2
Land
29 m2
-Sols
2025-04-07
85 000 
2 297  /m²(37 m²)
Sale
Apartments
Apartment
2 rooms
37 m2
2 outbuildings
Land
30 m2
-Jardins
Land
38 m2
-Sols
Land
86 m2
-Sols
2025-04-04
140 000 
2 333  /m²(60 m²)
Sale
Apartments
Apartment
3 rooms
60 m2
1 outbuilding
2025-04-01
370 000 
3 162  /m²(117 m²)
Sale
Houses
House
4 rooms
117 m2
Land
787 m2
-Sols
Land
785 m2
-Vignes
Land
132 m2
-Terres
2025-03-28
350 000 
3 043  /m²(115 m²)
Sale
Houses
House
5 rooms
115 m2
Land
602 m2
-Sols
Land
621 m2
-Terrains à bâtir
Land
148 m2
-Sols
2025-03-28
109 930 
2 339  /m²(47 m²)
Sale
Apartments
Apartment
1 room
47 m2
2025-03-27
334 000 
3 929  /m²(85 m²)
Sale
Houses
House
3 rooms
85 m2
Land
1020 m2
-Landes
2025-03-17
120 000 
2 182  /m²(55 m²)
Sale
Apartments
Apartment
3 rooms
55 m2
1 outbuilding
2025-03-14
12 000 
Sale
1 outbuilding
2025-03-07
370 000 
3 936  /m²(94 m²)
Sale
Houses
House
4 rooms
94 m2
Land
317 m2
-Sols
Land
350 m2
-Jardins
2025-03-07
336 900 
3 584  /m²(94 m²)
Sale
Apartments
Apartment
3 rooms
94 m2
1 outbuilding
2025-02-21
352 837 
3 179  /m²(111 m²)
Sale
Houses
House
4 rooms
111 m2
Land
600 m2
-Sols
2025-02-20
265 000 
2 624  /m²(101 m²)
Sale
Apartments
Apartment
5 rooms
101 m2
2025-02-18
176 000 
2 839  /m²(62 m²)
Sale
Houses
House
3 rooms
62 m2
Land
62 m2
-Sols
Land
408 m2
-Jardins
2025-02-17
75 000 
Sale
Land
87 m2
-Sols
1226 transactions listed in the municipality

Alpes-de-Haute-Provence (04)

Most expensive cities

City
name
Descending orderHouses
house
Price per m²
4 318 
3 484 
3 440 
3 310 
3 174 
City
name
Descending orderApartments
apt.
Price per m²
100 000 
3 360 
3 063 
2 803 
2 734 
2 638 
2 558 

Least expensive cities

City
name
Ascending orderHouses
house
Price per m²
570 
600 
1 032 
1 096 
1 167 
1 202 
1 207 
City
name
Ascending orderApartments
apt.
Price per m²
132 
379 
489 
543 
592 
625 
668 
679