emooki
HomePrice mapTransactions
🇬🇧 English🇫🇷 Français🇩🇪 Deutsch🇪🇸 Español🇮🇹 Italiano

Real estate price map


Real estate price map in the municipality of Virignin, choose a section to see transactions by parcel.

Ain (01)

Virignin - Real estate price m²

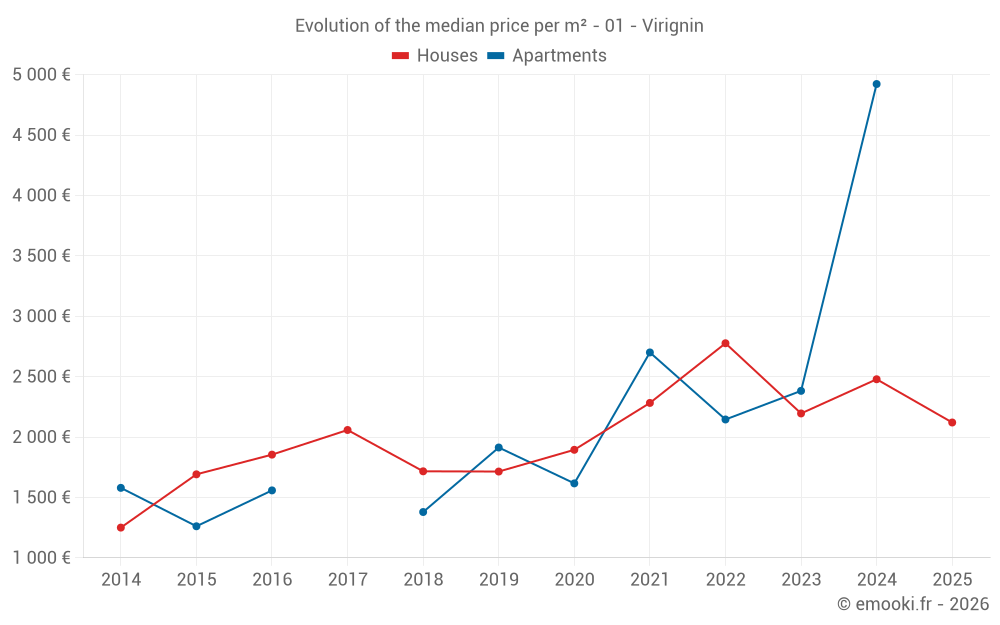
Median price of real estate
in the municipality of Virignin

HousesHouses
2 222  /m²
1-23-45-67-89-10
Reliability 7/10
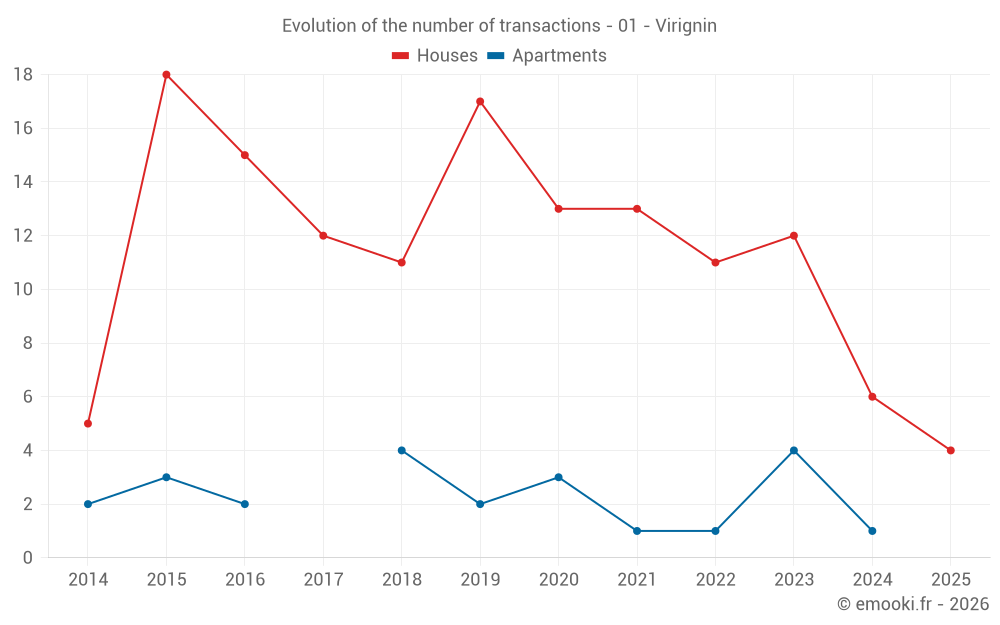
Median price on the 17 transactions of the last 24 months.
from 1 575 to
2 914  /m²
60% of transactions from the 2nd to the 8th deciles.
ApartmentsApartments
2 382  /m²
1-23-45-67-89-10
Reliability 4/10
Median price on the 8 transactions of the last 60 months.
DwellingsDwellings
2 288  /m²
1-23-45-67-89-10
Reliability 7/10
Median price on the 18 transactions of the last 24 months.
from 1 638 to
3 127  /m²
60% of transactions from the 2nd to the 8th deciles.
HousesEvolution of the price per m² of houses since...
1 year
-14%
2 years
-3.4%
3 years
-24%
4 years
-7.1%
5 years
+12%
6 years
+24%
7 years
+24%
8 years
+3%
9 years
+14%
10 years
+25%
11 years
+70%
The price per m² of houses has decreased by 24% since 3 years, but it has increased by 70% in 11 years.

Yearly evolution

Evolution of the median price per m²

Evolution of the median price per m² - 01 - Virignin

Evolution of the number of transactions

Warning, last year incomplete. Projections made based on the proportions between semesters of the previous year at the departmental/national level and by type of property.

Evolution of the number of transactions - 01 - Virignin

Yearly data

Descending order
Year
Houses
house
transactions
Houses
house
Price per m²
Apartments
apt.
transactions
Apartments
apt.
Price per m²
2025
4
2 120 
0
--- 
2024
6
2 478 
1
4 922 
2023
12
2 195 
4
2 382 
2022
11
2 776 
1
2 145 
2021
13
2 282 
1
2 700 
2020
13
1 894 
3
1 616 
2019
17
1 714 
2
1 913 
2018
11
1 716 
4
1 379 
2017
12
2 058 
0
--- 
2016
15
1 854 
2
1 558 
2015
18
1 691 
3
1 261 
2014
5
1 250 
2
1 579 

Analysis

Structure of prices per m²

Values of price percentiles per m² over the periods used for the estimated price of each type of property.

Structure of transaction amounts

Values of transaction amounts percentiles over the periods used for the estimated price of each type of property.

Transaction amounts and prices per m² by percentile

Ascending order
Percentile
Houses
house
Price per m²
Houses
house
Transaction amount
Apartments
apt.
Price per m²
Apartments
apt.
Transaction amount
10th percentile
1 291 
98 000 
1 294 
78 150 
20th percentile
1 575 
133 K
1 828 
90 400 
30th percentile
1 966 
225 K
2 167 
102 K
40th percentile
2 165 
240 K
2 319 
114 K
50th percentile
2 222 
250 K
2 382 
133 K
60th percentile
2 504 
308 K
2 433 
151 K
70th percentile
2 716 
401 K
2 548 
159 K
80th percentile
2 914 
440 K
2 646 
178 K
90th percentile
3 551 
496 K
3 367 
227 K

National and departmental comparison

Evolution of the median price per m² of houses

Evolution of the median price per m² of apartments

Quarterly evolution

Evolution of the median price per m²

Evolution of the number of transactions

Quarterly data

Descending order
Quarter
Houses
house
transactions
Houses
house
Price per m²
Apartments
apt.
transactions
Apartments
apt.
Price per m²
2025 Q2
2
1 284 
0
--- 
2025 Q1
2
3 093 
0
--- 
2024 Q4
2
1 446 
1
4 922 
2024 Q3
2
3 166 
0
--- 
2024 Q2
2
2 744 
0
--- 
2023 Q4
2
2 337 
0
--- 
2023 Q3
5
2 168 
0
--- 
2023 Q2
0
--- 
2
2 482 
2023 Q1
5
2 404 
2
1 452 
2022 Q4
4
2 652 
0
--- 
2022 Q3
1
4 059 
0
--- 
2022 Q2
3
2 821 
0
--- 
2022 Q1
3
2 670 
1
2 145 
2021 Q4
4
2 473 
0
--- 
2021 Q3
3
2 788 
0
--- 
2021 Q2
1
2 545 
1
2 700 
2021 Q1
5
1 519 
0
--- 
2020 Q4
5
1 719 
0
--- 
2020 Q3
5
2 226 
1
1 616 
2020 Q2
1
2 324 
2
1 584 
2020 Q1
2
1 484 
0
--- 
2019 Q4
9
1 481 
0
--- 
2019 Q3
5
2 061 
1
1 790 
2019 Q1
3
1 676 
1
2 036 
2018 Q4
4
1 685 
1
1 932 
2018 Q3
6
1 794 
1
311 
2018 Q2
0
--- 
1
1 098 
2018 Q1
1
1 814 
1
1 660 
2017 Q4
1
1 545 
0
--- 
2017 Q3
5
1 632 
0
--- 
2017 Q2
2
2 165 
0
--- 
2017 Q1
4
2 062 
0
--- 
2016 Q4
5
2 064 
0
--- 
2016 Q3
1
1 984 
0
--- 
2016 Q2
3
1 767 
1
975 
2016 Q1
6
1 470 
1
2 141 
2015 Q4
3
2 011 
0
--- 
2015 Q3
5
1 679 
0
--- 
2015 Q2
7
1 449 
1
1 261 
2015 Q1
3
1 765 
2
966 
2014 Q4
3
1 156 
0
--- 
2014 Q3
1
2 641 
2
1 579 
2014 Q2
1
1 739 
0
--- 

Overview of the latest real estate transactions

The following list is an anonymized overview of the latest transactions. For more details and to find all transactions, please use the map to view transactions by plot or the transaction search page for a search by criteria.

2025-05-22
110 000 
1 250  /m²(88 m²)
Sale
Houses
House
4 rooms
88 m2
Land
493 m2
-Sols
Land
663 m2
-Terrains à bâtir
2025-04-22
1 376 
Sale
Land
2751 m2
-Terres
Land
2752 m2
-Terres
2025-04-16
95 000 
1 319  /m²(72 m²)
Sale
Houses
House
4 rooms
72 m2
1 outbuilding
Land
141 m2
-Sols
Land
250 m2
-Landes
/Pâture plantée
Land
70 m2
-Sols
Land
187 m2
-Sols
Land
34 m2
-Sols
2025-04-04
174 000 
Sale
Land
2431 m2
-Terres
2025-03-13
260 000 
2 921  /m²(89 m²)
Sale
Houses
House
5 rooms
89 m2
Land
1160 m2
-Sols
Land
435 m2
-Terres
2025-02-27
444 040 
3 265  /m²(136 m²)
Sale
Houses
House
5 rooms
136 m2
Land
724 m2
-Sols
Land
2633 m2
-Prés
Land
173 m2
-Jardins
Land
423 m2
-Sols
2024-12-30
225 000 
2 163  /m²(104 m²)
Sale
Houses
House
5 rooms
104 m2
1 outbuilding
Land
1225 m2
-Sols
2024-11-27
205 000 
1 367  /m²(150 m²)
1 864  /m²(110 m²)
Sale
Apartments
Apartment
4 rooms
110 m2
Commercial property
40 m2
Land
141 m2
-Sols
2024-11-27
30 000 
227  /m²(132 m²)
Sale
Commercial property
132 m2
Land
255 m2
-Sols
Land
8498 m2
-Terres
Land
13 m2
-Sols
2024-10-25
11 000 
Sale
Land
18529 m2
-Terres
Land
1446 m2
-Terres
Land
2894 m2
-Terres
Land
1087 m2
-Taillis simples
Land
2808 m2
-Taillis simples
Land
433 m2
-Taillis simples
Land
3726 m2
-Terres
Land
492 m2
-Terres
Land
3113 m2
-Landes
/Pâture plantée
Land
743 m2
-Landes
/Friche
Land
1495 m2
-Taillis simples
Land
2070 m2
-Taillis simples
Land
639 m2
-Taillis simples
Land
2047 m2
-Prés
Land
6422 m2
-Prés
Land
3630 m2
-Taillis simples
Land
1689 m2
-Prés
Land
393 m2
-Taillis simples
Land
997 m2
-Taillis simples
Land
660 m2
-Taillis simples
Land
5082 m2
-Terres
Land
5355 m2
-Taillis simples
Land
2678 m2
-Taillis simples
Land
1987 m2
-Taillis simples
Land
3974 m2
-Taillis simples
Land
7083 m2
-Taillis simples
Land
1417 m2
-Taillis simples
Land
708 m2
-Peupleraies
Land
3935 m2
-Terres
Land
1613 m2
-Landes
/Friche
Land
16 m2
-Sols
Land
3447 m2
-Landes
/Friche
Land
1083 m2
-Terres
Land
3264 m2
-Terres
2024-10-17
315 000 
4 922  /m²(64 m²)
Sale
Apartments
Apartment
3 rooms
64 m2
Land
588 m2
-Sols
2024-10-02
67 000 
728  /m²(92 m²)
Sale
Houses
House
3 rooms
92 m2
1 outbuilding
Land
534 m2
-Sols
2024-09-23
2 000 
Sale
Land
4137 m2
-Terres
2024-07-31
35 500 
Sale
Land
115 m2
-Sols
Land
322 m2
-Taillis simples
2024-07-16
652 800 
3 980  /m²(164 m²)
Sale
Houses
House
4 rooms
164 m2
1 outbuilding
Land
1377 m2
-Sols
Land
471 m2
-Terrains d'agrément
2024-07-15
240 000 
2 353  /m²(102 m²)
Sale
1 outbuilding
Land
22 m2
-Sols
Houses
House
4 rooms
102 m2
Land
70 m2
-Sols
Land
95 m2
-Prés
Land
1054 m2
-Prés
Land
25 m2
-Sols
2024-06-10
225 000 
2 885  /m²(78 m²)
Sale
Houses
House
4 rooms
78 m2
1 outbuilding
Land
225 m2
-Sols
Land
670 m2
-Terres
Land
85 m2
-Sols
Land
15 m2
-Sols
Land
93 m2
-Sols
2024-05-03
250 000 
2 604  /m²(96 m²)
Sale
Houses
House
4 rooms
96 m2
Land
411 m2
-Sols
2024-03-20
200 000 
901  /m²(222 m²)
Sale
Commercial property
222 m2
Land
2477 m2
-Sols
2024-03-05
125 000 
Sale
Land
500 m2
-Sols
Land
2118 m2
-Terrains d'agrément
332 transactions listed in the municipality

Ain (01)

Most expensive cities

City
name
Descending orderHouses
house
Price per m²
5 676 
5 576 
5 534 
5 509 
5 248 
5 159 
5 146 
City
name
Descending orderApartments
apt.
Price per m²
5 372 
5 062 
5 000 
4 942 
4 889 
4 836 
4 787 
4 691 

Least expensive cities

City
name
Ascending orderHouses
house
Price per m²
797 
808 
816 
893 
927 
958 
1 034 
1 046 
City
name
Ascending orderApartments
apt.
Price per m²
157 
174 
185 
217 
336 
349 
380 
421 
444