emooki
HomePrice mapTransactions
🇬🇧 English🇫🇷 Français🇩🇪 Deutsch🇪🇸 Español🇮🇹 Italiano

Real estate price map


Real estate price map in the municipality of Vesancy, choose a section to see transactions by parcel.

Ain (01)

Vesancy - Real estate price m²

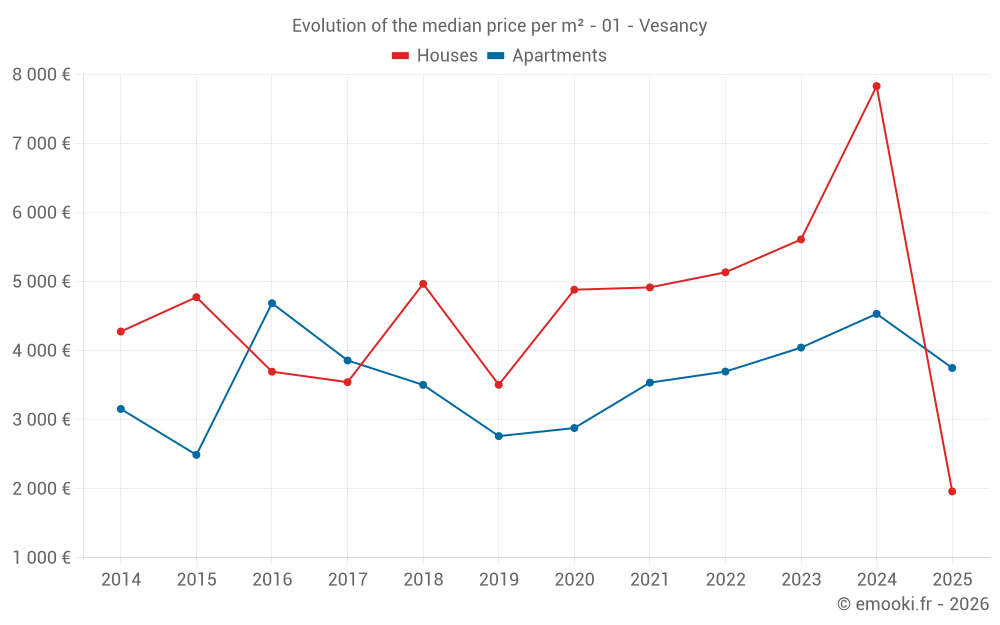
Median price of real estate
in the municipality of Vesancy

HousesHouses
4 917  /m²
1-23-45-67-89-10
Reliability 5/10
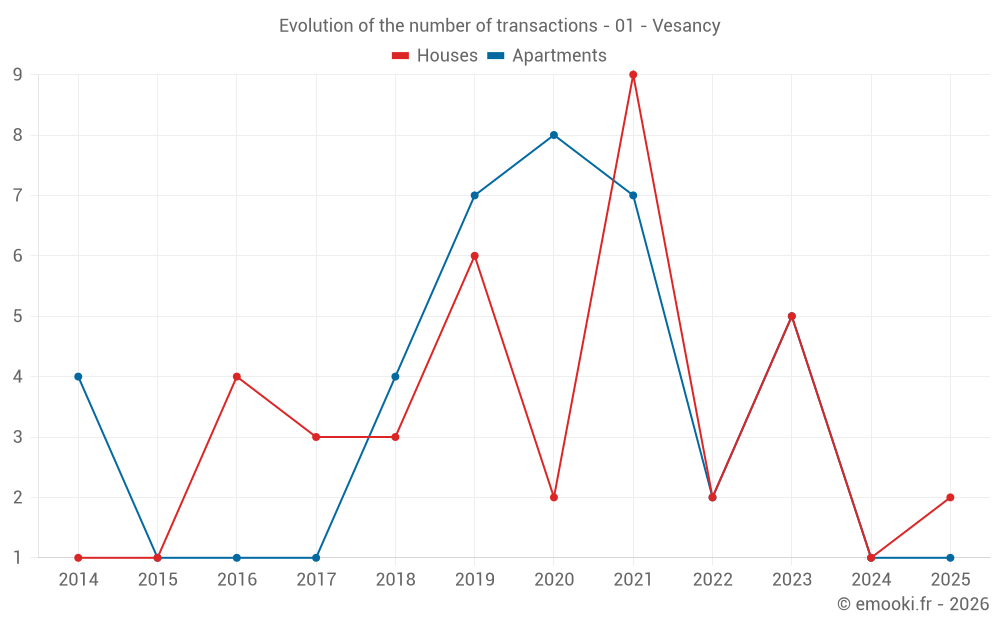
Median price on the 15 transactions of the last 48 months.
from 4 292 to
6 096  /m²
60% of transactions from the 2nd to the 8th deciles.
ApartmentsApartments
3 910  /m²
1-23-45-67-89-10
Reliability 5/10
Median price on the 16 transactions of the last 48 months.
from 2 338 to
4 503  /m²
60% of transactions from the 2nd to the 8th deciles.
DwellingsDwellings
4 192  /m²
1-23-45-67-89-10
Reliability 6/10
Median price on the 18 transactions of the last 36 months.
from 3 512 to
5 800  /m²
60% of transactions from the 2nd to the 8th deciles.

Yearly evolution

Evolution of the median price per m²

Evolution of the median price per m² - 01 - Vesancy

Evolution of the number of transactions

Warning, last year incomplete. Projections made based on the proportions between semesters of the previous year at the departmental/national level and by type of property.

Evolution of the number of transactions - 01 - Vesancy

Yearly data

Descending order
Year
Houses
house
transactions
Houses
house
Price per m²
Apartments
apt.
transactions
Apartments
apt.
Price per m²
2025
2
1 961 
1
3 750 
2024
1
7 833 
1
4 534 
2023
5
5 612 
5
4 045 
2022
2
5 136 
2
3 698 
2021
9
4 917 
7
3 538 
2020
2
4 884 
8
2 880 
2019
6
3 506 
7
2 763 
2018
3
4 969 
4
3 505 
2017
3
3 544 
1
3 859 
2016
4
3 696 
1
4 688 
2015
1
4 776 
1
2 491 
2014
1
4 278 
4
3 156 

Analysis

Structure of prices per m²

Values of price percentiles per m² over the periods used for the estimated price of each type of property.

Structure of transaction amounts

Values of transaction amounts percentiles over the periods used for the estimated price of each type of property.

Transaction amounts and prices per m² by percentile

Ascending order
Percentile
Houses
house
Price per m²
Houses
house
Transaction amount
Apartments
apt.
Price per m²
Apartments
apt.
Transaction amount
10th percentile
3 354 
304 K
1 414 
161 K
20th percentile
4 292 
564 K
2 338 
180 K
30th percentile
4 505 
616 K
3 446 
188 K
40th percentile
4 732 
658 K
3 750 
248 K
50th percentile
4 917 
705 K
3 910 
273 K
60th percentile
5 738 
755 K
4 043 
317 K
70th percentile
5 967 
777 K
4 078 
380 K
80th percentile
6 096 
796 K
4 503 
450 K
90th percentile
6 479 
884 K
4 767 
510 K

National and departmental comparison

Evolution of the median price per m² of houses

Evolution of the median price per m² of apartments

Quarterly evolution

Evolution of the median price per m²

Evolution of the number of transactions

Quarterly data

Descending order
Quarter
Houses
house
transactions
Houses
house
Price per m²
Apartments
apt.
transactions
Apartments
apt.
Price per m²
2025 Q2
1
1 182 
1
3 750 
2025 Q1
1
2 740 
0
--- 
2024 Q4
1
7 833 
0
--- 
2024 Q2
0
--- 
1
4 534 
2023 Q4
0
--- 
1
4 111 
2023 Q3
1
6 478 
4
3 992 
2023 Q2
2
5 100 
0
--- 
2023 Q1
2
5 054 
0
--- 
2022 Q4
1
5 977 
1
4 043 
2022 Q3
0
--- 
1
3 354 
2022 Q1
1
4 296 
0
--- 
2021 Q4
3
6 000 
4
2 276 
2021 Q3
2
4 889 
3
3 879 
2021 Q2
4
4 506 
0
--- 
2020 Q4
0
--- 
2
3 054 
2020 Q3
1
4 430 
2
4 046 
2020 Q2
1
5 338 
1
2 448 
2020 Q1
0
--- 
3
2 424 
2019 Q4
1
3 781 
5
2 571 
2019 Q3
1
2 725 
1
3 929 
2019 Q2
3
3 230 
0
--- 
2019 Q1
1
4 084 
1
2 788 
2018 Q4
2
5 256 
2
3 362 
2018 Q2
0
--- 
1
3 367 
2018 Q1
1
4 969 
1
4 863 
2017 Q3
1
3 085 
0
--- 
2017 Q2
1
3 544 
0
--- 
2017 Q1
1
4 096 
1
3 859 
2016 Q4
1
3 432 
0
--- 
2016 Q3
0
--- 
1
4 688 
2016 Q2
2
3 640 
0
--- 
2016 Q1
1
4 722 
0
--- 
2015 Q3
1
4 776 
0
--- 
2015 Q2
0
--- 
1
2 491 
2014 Q4
0
--- 
2
3 367 
2014 Q2
1
4 278 
1
3 507 
2014 Q1
0
--- 
1
2 585 

Overview of the latest real estate transactions

The following list is an anonymized overview of the latest transactions. For more details and to find all transactions, please use the map to view transactions by plot or the transaction search page for a search by criteria.

2025-06-11
450 000 
3 750  /m²(120 m²)
Sale
Apartments
Apartment
4 rooms
120 m2
3 outbuildings
2025-05-22
10 000 
Sale
Land
200 m2
-Jardins
2025-04-25
65 000 
1 182  /m²(55 m²)
Sale
Houses
House
1 room
55 m2
1 outbuilding
Land
50 m2
-Sols
2025-04-15
30 000 
Sale
Land
105 m2
-Jardins
Land
205 m2
-Jardins
2025-01-07
200 000 
2 740  /m²(73 m²)
Sale
Houses
House
4 rooms
73 m2
2 outbuildings
Land
185 m2
-Sols
2024-12-02
705 000 
7 833  /m²(90 m²)
Sale
Houses
House
4 rooms
90 m2
Land
942 m2
-Prés
Land
558 m2
-Sols
2024-10-30
3 600 
Sale
Land
3600 m2
-Prés
2024-05-06
317 361 
4 534  /m²(70 m²)
Sale
Apartments
Apartment
3 rooms
70 m2
2 outbuildings
2024-02-22
29 556 
Sale
Land
2856 m2
-Terres
Land
60 m2
-Terres
Land
2010 m2
-Terres
2023-12-29
429 159 
Sale
Land
320 m2
-Terrains à bâtir
Land
299 m2
-Terrains à bâtir
Land
25 m2
-Terrains à bâtir
2023-10-16
8 800 
Sale
Land
44 m2
-Sols
2023-10-02
185 000 
4 111  /m²(45 m²)
Sale
Apartments
Apartment
2 rooms
45 m2
2 outbuildings
2023-09-25
157 600 
4 503  /m²(35 m²)
Sale
Apartments
Apartment
1 room
35 m2
2 outbuildings
2023-09-21
409 800 
3 940  /m²(104 m²)
Sale
Apartments
Apartment
4 rooms
104 m2
3 outbuildings
2023-09-13
913 450 
6 478  /m²(141 m²)
Sale
Houses
House
6 rooms
141 m2
1 outbuilding
Land
656 m2
-Jardins
Land
1000 m2
-Sols
2023-09-12
350 000 
1 813  /m²(193 m²)
Sale
Apartments
Apartment
6 rooms
193 m2
1 outbuilding
2023-07-03
271 000 
4 045  /m²(67 m²)
Sale
Apartments
Apartment
4 rooms
67 m2
1 outbuilding
2023-06-16
965 860 
4 274  /m²(226 m²)
Sale
Houses
House
6 rooms
226 m2
Land
266 m2
-Sols
Land
997 m2
-Vergers
2023-04-28
640 000 
5 926  /m²(108 m²)
Sale
Houses
House
6 rooms
108 m2
1 outbuilding
Land
1285 m2
-Sols
Land
403 m2
-Terres
2023-04-25
20 000 
Sale
Land
221 m2
-Terres
148 transactions listed in the municipality

Ain (01)

Most expensive cities

City
name
Descending orderHouses
house
Price per m²
5 676 
5 576 
5 534 
5 509 
5 248 
5 159 
5 146 
City
name
Descending orderApartments
apt.
Price per m²
5 372 
5 062 
5 000 
4 942 
4 889 
4 836 
4 787 
4 691 

Least expensive cities

City
name
Ascending orderHouses
house
Price per m²
797 
808 
816 
893 
927 
958 
1 034 
1 046 
City
name
Ascending orderApartments
apt.
Price per m²
157 
174 
185 
217 
336 
349 
380 
421 
444