emooki
HomePrice mapTransactions
🇬🇧 English🇫🇷 Français🇩🇪 Deutsch🇪🇸 Español🇮🇹 Italiano

Real estate price map


Real estate price map in the municipality of Crozet, choose a section to see transactions by parcel.

Ain (01)

Crozet - Real estate price m²

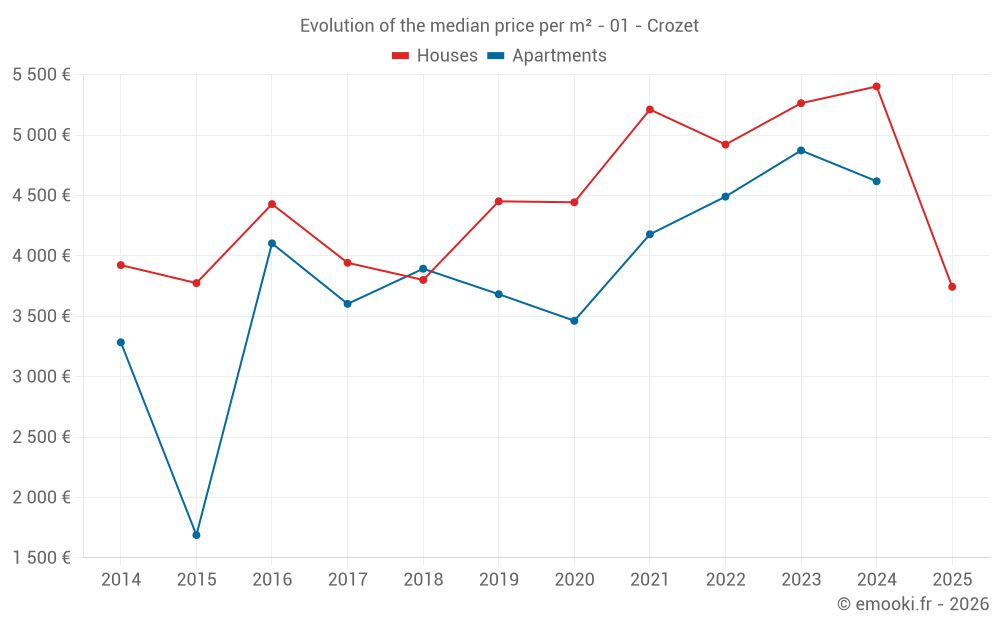
Median price of real estate
in the municipality of Crozet

HousesHouses
5 146  /m²
1-23-45-67-89-10
Reliability 8/10
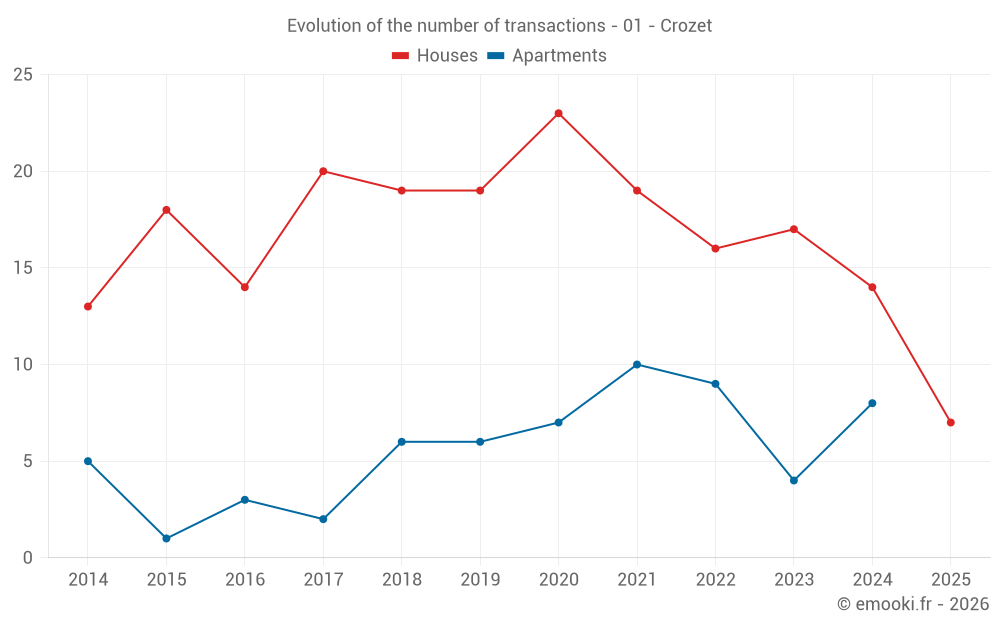
Median price on the 17 transactions of the last 12 months.
from 3 322 to
5 623  /m²
60% of transactions from the 2nd to the 8th deciles.
ApartmentsApartments
4 624  /m²
1-23-45-67-89-10
Reliability 6/10
Median price on the 17 transactions of the last 36 months.
from 4 084 to
5 241  /m²
60% of transactions from the 2nd to the 8th deciles.
DwellingsDwellings
4 736  /m²
1-23-45-67-89-10
Reliability 8/10
Median price on the 22 transactions of the last 12 months.
from 3 744 to
5 623  /m²
60% of transactions from the 2nd to the 8th deciles.
HousesEvolution of the price per m² of houses since...
1 year
-31%
2 years
-29%
3 years
-24%
4 years
-28%
5 years
-16%
6 years
-16%
7 years
-1.5%
8 years
-5%
9 years
-15%
10 years
-0.8%
11 years
-4.6%

Yearly evolution

Evolution of the median price per m²

Evolution of the median price per m² - 01 - Crozet

Evolution of the number of transactions

Warning, last year incomplete. Projections made based on the proportions between semesters of the previous year at the departmental/national level and by type of property.

Evolution of the number of transactions - 01 - Crozet

Yearly data

Descending order
Year
Houses
house
transactions
Houses
house
Price per m²
Apartments
apt.
transactions
Apartments
apt.
Price per m²
2025
7
3 743 
0
--- 
2024
14
5 402 
8
4 617 
2023
17
5 263 
4
4 872 
2022
16
4 921 
9
4 490 
2021
19
5 211 
10
4 178 
2020
23
4 443 
7
3 462 
2019
19
4 451 
6
3 682 
2018
19
3 800 
6
3 893 
2017
20
3 942 
2
3 602 
2016
14
4 428 
3
4 103 
2015
18
3 774 
1
1 688 
2014
13
3 923 
5
3 284 

Analysis

Structure of prices per m²

Values of price percentiles per m² over the periods used for the estimated price of each type of property.

Structure of transaction amounts

Values of transaction amounts percentiles over the periods used for the estimated price of each type of property.

Transaction amounts and prices per m² by percentile

Ascending order
Percentile
Houses
house
Price per m²
Houses
house
Transaction amount
Apartments
apt.
Price per m²
Apartments
apt.
Transaction amount
10th percentile
2 808 
427 K
3 747 
235 K
20th percentile
3 322 
549 K
4 084 
266 K
30th percentile
3 749 
607 K
4 322 
271 K
40th percentile
4 356 
622 K
4 515 
325 K
50th percentile
5 146 
685 K
4 624 
349 K
60th percentile
5 313 
701 K
4 664 
353 K
70th percentile
5 451 
750 K
4 846 
380 K
80th percentile
5 623 
807 K
5 241 
436 K
90th percentile
6 093 
895 K
5 643 
509 K

National and departmental comparison

Evolution of the median price per m² of houses

Evolution of the median price per m² of apartments

Quarterly evolution

Evolution of the median price per m²

Evolution of the number of transactions

Quarterly data

Descending order
Quarter
Houses
house
transactions
Houses
house
Price per m²
Apartments
apt.
transactions
Apartments
apt.
Price per m²
2025 Q2
4
4 486 
0
--- 
2025 Q1
3
3 217 
0
--- 
2024 Q4
5
5 515 
2
5 365 
2024 Q3
5
5 369 
3
4 111 
2024 Q2
3
2 619 
1
4 375 
2024 Q1
1
6 944 
2
5 298 
2023 Q4
3
5 909 
2
4 186 
2023 Q3
3
4 197 
1
4 639 
2023 Q2
6
4 662 
0
--- 
2023 Q1
5
5 263 
1
5 104 
2022 Q4
3
5 650 
5
4 490 
2022 Q3
7
4 917 
0
--- 
2022 Q2
2
4 740 
1
4 540 
2022 Q1
4
4 976 
3
3 883 
2021 Q4
7
5 409 
5
3 699 
2021 Q3
7
5 701 
2
4 402 
2021 Q2
4
4 968 
1
3 429 
2021 Q1
1
3 968 
2
4 860 
2020 Q4
13
4 845 
2
3 604 
2020 Q3
6
4 042 
3
3 482 
2020 Q2
1
2 542 
2
2 717 
2020 Q1
3
3 497 
0
--- 
2019 Q4
6
3 856 
1
3 437 
2019 Q3
3
4 713 
1
3 581 
2019 Q2
7
4 054 
3
3 784 
2019 Q1
3
4 548 
1
3 962 
2018 Q4
5
3 683 
3
3 827 
2018 Q3
5
3 275 
0
--- 
2018 Q2
4
4 575 
1
3 979 
2018 Q1
5
3 921 
2
2 775 
2017 Q4
5
4 527 
1
3 778 
2017 Q3
3
4 061 
0
--- 
2017 Q2
6
3 848 
0
--- 
2017 Q1
6
3 658 
1
3 425 
2016 Q4
3
4 098 
2
3 602 
2016 Q3
5
4 505 
1
4 395 
2016 Q2
5
4 855 
0
--- 
2016 Q1
1
4 675 
0
--- 
2015 Q4
6
3 903 
1
1 688 
2015 Q3
2
3 752 
0
--- 
2015 Q2
5
4 187 
0
--- 
2015 Q1
5
3 476 
0
--- 
2014 Q4
0
--- 
2
3 264 
2014 Q3
6
3 886 
1
4 011 
2014 Q2
4
4 384 
0
--- 
2014 Q1
3
3 231 
2
3 384 

Overview of the latest real estate transactions

The following list is an anonymized overview of the latest transactions. For more details and to find all transactions, please use the map to view transactions by plot or the transaction search page for a search by criteria.

2025-05-07
750 000 
6 250  /m²(120 m²)
Sale
Houses
House
5 rooms
120 m2
Land
988 m2
-Sols
Land
71 m2
-Sols
2025-04-28
685 000 
5 229  /m²(131 m²)
Sale
Houses
House
6 rooms
131 m2
2025-04-24
465 000 
2 583  /m²(180 m²)
Sale
Apartments
Apartment
2 rooms
45 m2
Houses
House
5 rooms
135 m2
2 outbuildings
Land
856 m2
-Sols
2025-04-11
688 700 
3 743  /m²(184 m²)
Sale
Houses
House
5 rooms
184 m2
Land
1837 m2
-Prés
Land
598 m2
-Sols
2025-03-27
370 000 
3 217  /m²(115 m²)
Sale
Houses
House
6 rooms
115 m2
1 outbuilding
Land
1122 m2
-Sols
2025-03-13
875 
Sale
Land
175 m2
-Terres
2025-03-07
6 069 
Sale
Land
1415 m2
-Terres
Land
558 m2
-Taillis simples
2025-03-07
6 067 
Sale
Land
1415 m2
-Terres
Land
557 m2
-Taillis simples
2025-02-25
900 000 
3 750  /m²(240 m²)
Sale
Houses
House
6 rooms
240 m2
2 outbuildings
2025-01-30
710 000 
2 958  /m²(240 m²)
Sale
Houses
House
6 rooms
240 m2
2 outbuildings
2024-12-18
267 700 
5 949  /m²(45 m²)
Sale
Apartments
Apartment
2 rooms
45 m2
3 outbuildings
2024-12-13
750 000 
5 515  /m²(136 m²)
Sale
Houses
House
5 rooms
136 m2
2024-11-29
617 500 
5 146  /m²(120 m²)
Sale
Houses
House
5 rooms
120 m2
Land
323 m2
-Sols
Land
1 m2
-Terrains à bâtir
Land
3 m2
-Terrains à bâtir
2024-11-28
2 454 
Sale
Land
2860 m2
-Prés
Land
1230 m2
-Taillis simples
2024-11-25
545 000 
5 989  /m²(91 m²)
Sale
Houses
House
5 rooms
91 m2
Land
477 m2
-Sols
Land
50 m2
-Sols
Land
250 m2
-Sols
Land
109 m2
-Terres
2024-11-08
1 194 000 
9 629  /m²(124 m²)
Sale
Houses
House
7 rooms
124 m2
1 outbuilding
Land
385 m2
-Prés
Land
1000 m2
-Sols
Land
290 m2
-Sols
Land
89 m2
-Prés
Land
1419 m2
-Prés
2024-10-31
821 000 
4 691  /m²(175 m²)
Sale
Houses
House
5 rooms
175 m2
Land
1000 m2
-Sols
2024-10-18
15 833 
Sale
Land
13272 m2
-Terres
Land
6521 m2
-Terres
2024-10-02
349 000 
4 781  /m²(73 m²)
Sale
Apartments
Apartment
3 rooms
73 m2
1 outbuilding
2 outbuildings
2024-08-29
420 000 
3 925  /m²(107 m²)
Sale
Apartments
Apartment
4 rooms
107 m2
3 outbuildings
552 transactions listed in the municipality

Ain (01)

Most expensive cities

City
name
Descending orderHouses
house
Price per m²
5 676 
5 576 
5 534 
5 509 
5 248 
5 159 
5 146 
City
name
Descending orderApartments
apt.
Price per m²
5 372 
5 062 
5 000 
4 942 
4 889 
4 836 
4 787 
4 691 

Least expensive cities

City
name
Ascending orderHouses
house
Price per m²
797 
808 
816 
893 
927 
958 
1 034 
1 046 
City
name
Ascending orderApartments
apt.
Price per m²
157 
174 
185 
217 
336 
349 
380 
421 
444