emooki
HomePrice mapTransactions
🇬🇧 English🇫🇷 Français🇩🇪 Deutsch🇪🇸 Español🇮🇹 Italiano

Real estate price map


Real estate price map in the municipality of Trévoux, choose a section to see transactions by parcel.

Ain (01)
Trévoux

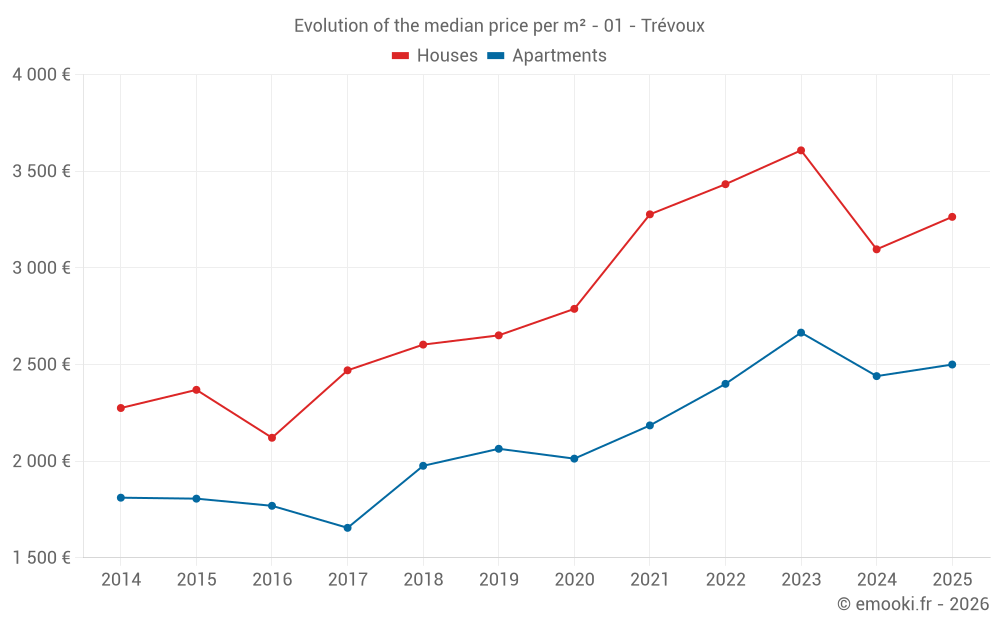
Median price of real estate
in the municipality of Trévoux

HousesHouses
3 221  /m²
1-23-45-67-89-10
Reliability 8/10
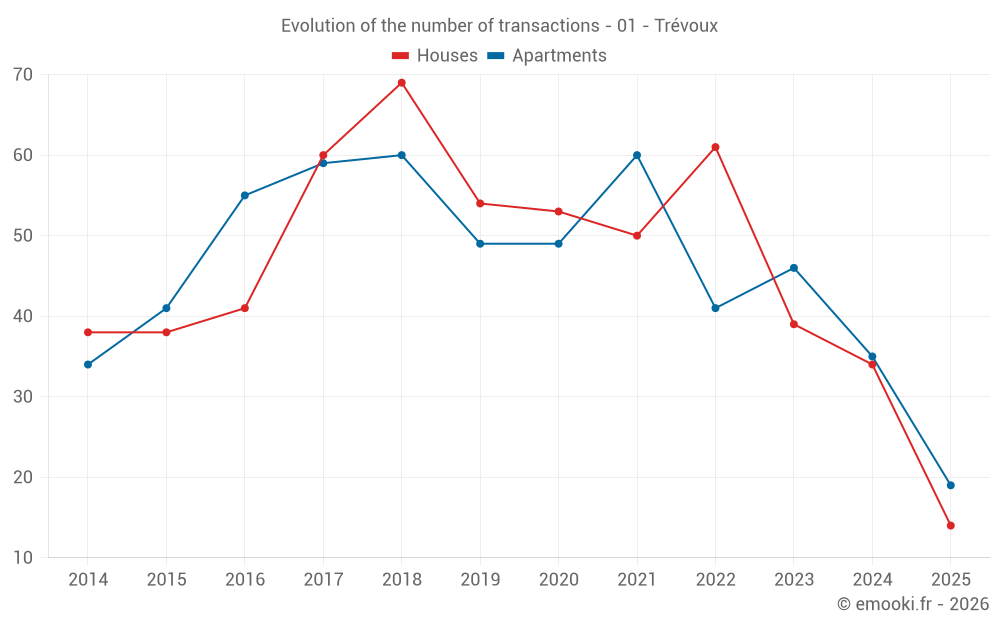
Median price on the 35 transactions of the last 12 months.
from 2 479 to
3 794  /m²
60% of transactions from the 2nd to the 8th deciles.
ApartmentsApartments
2 500  /m²
1-23-45-67-89-10
Reliability 9/10
Median price on the 19 transactions of the last 6 months.
from 1 563 to
3 397  /m²
60% of transactions from the 2nd to the 8th deciles.
DwellingsDwellings
2 820  /m²
1-23-45-67-89-10
Reliability 9/10
Median price on the 33 transactions of the last 6 months.
from 1 718 to
3 626  /m²
60% of transactions from the 2nd to the 8th deciles.
HousesEvolution of the price per m² of houses since...
1 year
+5.4%
2 years
-10%
3 years
-4.9%
4 years
-0.4%
5 years
+17%
6 years
+23%
7 years
+25%
8 years
+32%
9 years
+54%
10 years
+38%
11 years
+43%
The price per m² of houses has decreased by 10% since 2 years, but it has increased by 54% in 9 years.
ApartmentsEvolution of the price per m² of apartments since...
1 year
+2.5%
2 years
-6.2%
3 years
+4.2%
4 years
+14%
5 years
+24%
6 years
+21%
7 years
+27%
8 years
+51%
9 years
+41%
10 years
+38%
11 years
+38%
The price per m² of apartments has decreased by 6.2% since 2 years, but it has increased by 51% in 8 years.

Yearly evolution

Evolution of the median price per m²

Evolution of the number of transactions

Warning, last year incomplete. Projections made based on the proportions between semesters of the previous year at the departmental/national level and by type of property.

Yearly data

Descending order
Year
Houses
house
transactions
Houses
house
Price per m²
Apartments
apt.
transactions
Apartments
apt.
Price per m²
2025
14
3 264 
19
2 500 
2024
34
3 096 
35
2 440 
2023
39
3 608 
46
2 665 
2022
61
3 433 
41
2 400 
2021
50
3 277 
60
2 185 
2020
53
2 788 
49
2 013 
2019
54
2 651 
49
2 064 
2018
69
2 603 
60
1 976 
2017
60
2 470 
59
1 655 
2016
41
2 121 
55
1 769 
2015
38
2 369 
41
1 806 
2014
38
2 275 
34
1 811 

Analysis

Structure of prices per m²

Values of price percentiles per m² over the periods used for the estimated price of each type of property.

Structure of transaction amounts

Values of transaction amounts percentiles over the periods used for the estimated price of each type of property.

Transaction amounts and prices per m² by percentile

Ascending order
Percentile
Houses
house
Price per m²
Houses
house
Transaction amount
Apartments
apt.
Price per m²
Apartments
apt.
Transaction amount
10th percentile
1 889 
158 K
1 438 
94 000 
20th percentile
2 479 
219 K
1 563 
99 600 
30th percentile
2 788 
235 K
1 934 
112 K
40th percentile
3 027 
298 K
2 281 
131 K
50th percentile
3 221 
320 K
2 500 
141 K
60th percentile
3 354 
349 K
2 742 
176 K
70th percentile
3 658 
374 K
2 888 
207 K
80th percentile
3 794 
413 K
3 397 
221 K
90th percentile
4 364 
462 K
3 688 
251 K

National and departmental comparison

Evolution of the median price per m² of houses

Evolution of the median price per m² of apartments

Quarterly evolution

Evolution of the median price per m²

Evolution of the number of transactions

Quarterly data

Descending order
Quarter
Houses
house
transactions
Houses
house
Price per m²
Apartments
apt.
transactions
Apartments
apt.
Price per m²
2025 Q2
5
3 097 
11
2 500 
2025 Q1
9
3 346 
8
2 601 
2024 Q4
8
2 816 
7
2 200 
2024 Q3
13
3 289 
9
2 102 
2024 Q2
8
2 936 
12
2 537 
2024 Q1
5
3 302 
7
2 738 
2023 Q4
10
3 792 
11
2 791 
2023 Q3
8
3 604 
14
2 602 
2023 Q2
10
3 660 
13
2 946 
2023 Q1
11
3 565 
8
2 618 
2022 Q4
16
3 562 
11
2 700 
2022 Q3
19
3 647 
14
2 355 
2022 Q2
16
3 657 
8
2 800 
2022 Q1
10
2 996 
8
2 176 
2021 Q4
8
3 720 
11
2 254 
2021 Q3
13
3 523 
12
2 582 
2021 Q2
16
3 309 
21
2 059 
2021 Q1
13
2 998 
16
2 011 
2020 Q4
15
2 621 
13
1 911 
2020 Q3
14
2 612 
12
2 414 
2020 Q2
12
3 180 
13
2 240 
2020 Q1
12
2 705 
11
1 946 
2019 Q4
13
2 977 
12
2 224 
2019 Q3
17
2 514 
13
2 000 
2019 Q2
14
2 565 
9
2 125 
2019 Q1
10
3 074 
15
1 846 
2018 Q4
12
2 815 
21
2 109 
2018 Q3
27
2 755 
9
1 609 
2018 Q2
12
2 200 
18
1 644 
2018 Q1
18
2 573 
12
2 094 
2017 Q4
18
2 354 
12
1 799 
2017 Q3
18
2 791 
13
1 548 
2017 Q2
8
2 342 
12
1 414 
2017 Q1
16
2 310 
22
1 758 
2016 Q4
10
1 958 
16
1 712 
2016 Q3
9
2 148 
16
1 638 
2016 Q2
10
2 184 
14
2 059 
2016 Q1
12
2 302 
9
1 493 
2015 Q4
6
2 764 
10
2 006 
2015 Q3
10
2 152 
10
1 532 
2015 Q2
11
2 213 
9
2 000 
2015 Q1
11
2 365 
12
1 620 
2014 Q4
5
2 665 
14
1 558 
2014 Q3
15
2 177 
7
1 945 
2014 Q2
10
2 033 
7
1 855 
2014 Q1
8
2 160 
6
2 056 

Overview of the latest real estate transactions

The following list is an anonymized overview of the latest transactions. For more details and to find all transactions, please use the map to view transactions by plot or the transaction search page for a search by criteria.

2025-06-03
222 000 
1 480  /m²(150 m²)
Sale
Apartments
Apartment
3 rooms
54 m2
Apartments
Apartment
1 room
48 m2
Apartments
Apartment
2 rooms
48 m2
Land
92 m2
-Sols
2025-06-03
90 000 
3 600  /m²(25 m²)
Sale
Apartments
Apartment
2 rooms
25 m2
1 outbuilding
2025-05-23
250 000 
2 232  /m²(112 m²)
Sale
Apartments
Apartment
3 rooms
112 m2
1 outbuilding
2025-05-22
123 000 
1 618  /m²(76 m²)
Sale
Apartments
Apartment
3 rooms
76 m2
2025-05-20
156 600 
1 550  /m²(101 m²)
Sale
Houses
House
5 rooms
101 m2
Land
367 m2
-Sols
2025-05-19
92 500 
Sale
Land
11 m2
-Sols
Land
415 m2
-Sols
2025-05-19
162 000 
2 746  /m²(59 m²)
Sale
Apartments
Apartment
4 rooms
59 m2
1 outbuilding
2025-05-19
180 000 
3 600  /m²(50 m²)
Sale
1 outbuilding
Apartments
Apartment
2 rooms
50 m2
2025-05-16
361 500 
3 973  /m²(91 m²)
Sale
Houses
House
4 rooms
91 m2
Land
404 m2
-Sols
2025-05-16
95 000 
1 319  /m²(72 m²)
Sale
Apartments
Apartment
3 rooms
72 m2
1 outbuilding
2025-04-29
272 500 
3 097  /m²(88 m²)
Sale
Houses
House
4 rooms
88 m2
Land
110 m2
-Sols
Land
14 m2
-Sols
Land
1 m2
-Sols
Land
13 m2
-Sols
2025-04-28
295 000 
4 041  /m²(73 m²)
Sale
Apartments
Apartment
3 rooms
73 m2
1 outbuilding
2025-04-24
110 000 
2 391  /m²(46 m²)
Sale
Commercial property
46 m2
2025-04-23
100 000 
2 500  /m²(40 m²)
Sale
Apartments
Apartment
1 room
40 m2
2 outbuildings
1 outbuilding
2025-04-22
225 000 
2 394  /m²(94 m²)
Sale
Houses
House
5 rooms
94 m2
Land
864 m2
-Sols
2025-04-09
306 000 
3 221  /m²(95 m²)
Sale
Houses
House
5 rooms
95 m2
Land
408 m2
-Sols
2025-04-03
99 000 
1 356  /m²(73 m²)
Sale
Apartments
Apartment
3 rooms
73 m2
2025-04-02
141 000 
2 820  /m²(50 m²)
Sale
Apartments
Apartment
3 rooms
50 m2
1 outbuilding
1 outbuilding
2025-03-24
255 000 
4 048  /m²(63 m²)
Sale
Apartments
Apartment
3 rooms
63 m2
1 outbuilding
2025-03-24
140 000 
2 593  /m²(54 m²)
Sale
Houses
House
3 rooms
54 m2
Land
118 m2
-Sols
Land
66 m2
-Jardins
/Jardin potager

Ain (01)

Most expensive cities

City
name
Descending orderHouses
house
Price per m²
5 676 
5 576 
5 534 
5 509 
5 248 
5 159 
5 146 
City
name
Descending orderApartments
apt.
Price per m²
5 372 
5 062 
5 000 
4 942 
4 889 
4 836 
4 787 
4 691 

Least expensive cities

City
name
Ascending orderHouses
house
Price per m²
797 
808 
816 
893 
927 
958 
1 034 
1 046 
City
name
Ascending orderApartments
apt.
Price per m²
157 
174 
185 
217 
336 
349 
380 
421 
444