emooki
HomePrice mapTransactions
🇬🇧 English🇫🇷 Français🇩🇪 Deutsch🇪🇸 Español🇮🇹 Italiano

Real estate price map


Real estate price map in the municipality of Serrières-de-Briord.

Ain (01)
Serrières-de-Briord

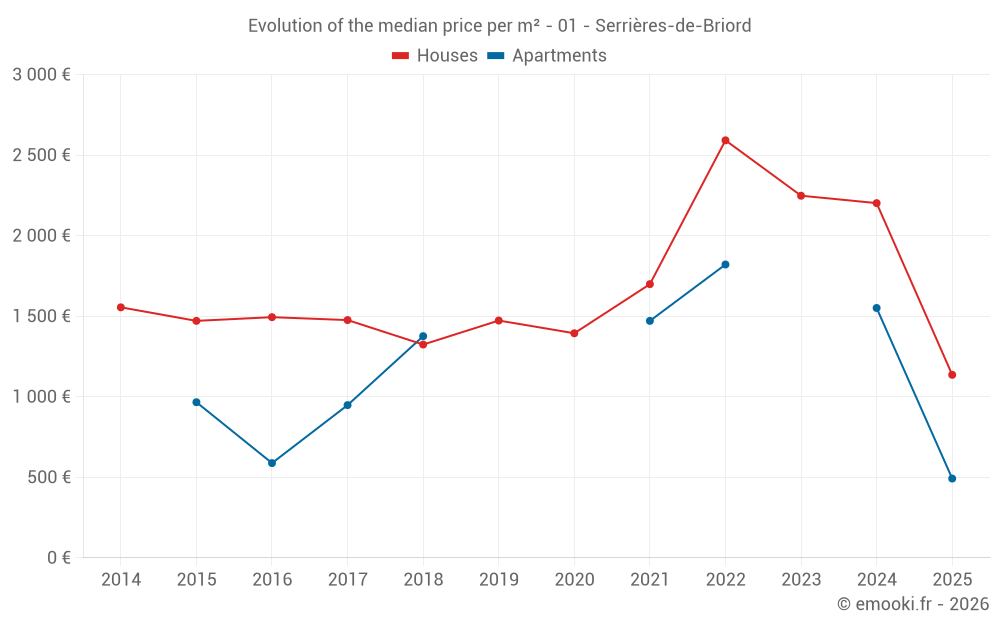
Median price of real estate
in the municipality of Serrières-de-Briord

HousesHouses
2 278  /m²
1-23-45-67-89-10
Reliability 7/10
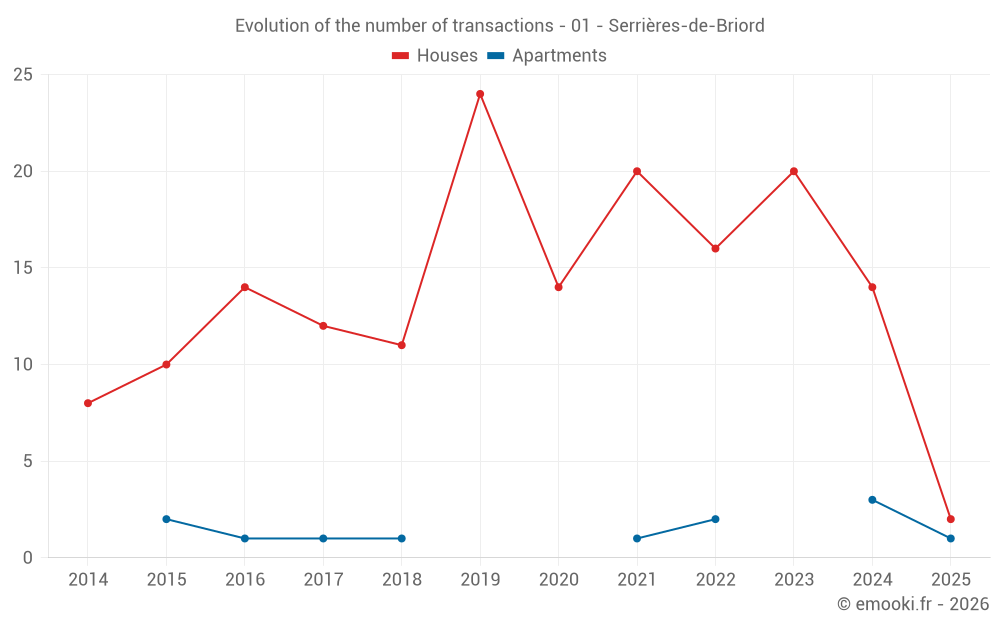
Median price on the 26 transactions of the last 24 months.
from 1 333 to
2 804  /m²
60% of transactions from the 2nd to the 8th deciles.
ApartmentsApartments
1 471  /m²
1-23-45-67-89-10
Reliability 3/10
Median price on the 7 transactions of the last 72 months.
DwellingsDwellings
2 066  /m²
1-23-45-67-89-10
Reliability 7/10
Median price on the 30 transactions of the last 24 months.
from 1 305 to
2 722  /m²
60% of transactions from the 2nd to the 8th deciles.
HousesEvolution of the price per m² of houses since...
1 year
--
2 years
--
3 years
--
4 years
--
5 years
--
6 years
--
7 years
--
8 years
--
9 years
--
10 years
--
11 years
--
ApartmentsEvolution of the price per m² of apartments since...
1 year
--
2 years
--
3 years
--
4 years
--
5 years
--
6 years
--
7 years
--
8 years
--
9 years
--
10 years
--
11 years
--

Yearly evolution

Evolution of the median price per m²

Evolution of the number of transactions

Warning, last year incomplete. Projections made based on the proportions between semesters of the previous year at the departmental/national level and by type of property.

Yearly data

Descending order
Year
Houses
house
transactions
Houses
house
Price per m²
Apartments
apt.
transactions
Apartments
apt.
Price per m²
2025
2
1 136 
1
492 
2024
14
2 202 
3
1 551 
2023
20
2 248 
0
--- 
2022
16
2 592 
2
1 821 
2021
20
1 699 
1
1 471 
2020
14
1 394 
0
--- 
2019
24
1 473 
0
--- 
2018
11
1 324 
1
1 376 
2017
12
1 476 
1
948 
2016
14
1 494 
1
588 
2015
10
1 471 
2
966 
2014
8
1 555 
0
--- 

Analysis

Structure of prices per m²

Values of price percentiles per m² over the periods used for the estimated price of each type of property.

Structure of transaction amounts

Values of transaction amounts percentiles over the periods used for the estimated price of each type of property.

Transaction amounts and prices per m² by percentile

Ascending order
Percentile
Houses
house
Price per m²
Houses
house
Transaction amount
Apartments
apt.
Price per m²
Apartments
apt.
Transaction amount
10th percentile
1 106 
95 500 
741 
69 500 
20th percentile
1 333 
135 K
948 
86 000 
30th percentile
1 894 
167 K
1 070 
96 500 
40th percentile
2 063 
180 K
1 255 
116 K
50th percentile
2 278 
215 K
1 471 
140 K
60th percentile
2 368 
225 K
1 519 
150 K
70th percentile
2 501 
247 K
1 555 
163 K
80th percentile
2 804 
258 K
1 569 
180 K
90th percentile
3 072 
266 K
1 956 
288 K

National and departmental comparison

Evolution of the median price per m² of houses

Evolution of the median price per m² of apartments

Quarterly evolution

Evolution of the median price per m²

Evolution of the number of transactions

Quarterly data

Descending order
Quarter
Houses
house
transactions
Houses
house
Price per m²
Apartments
apt.
transactions
Apartments
apt.
Price per m²
2025 Q2
1
938 
0
--- 
2025 Q1
1
1 333 
1
492 
2024 Q4
4
2 216 
1
1 573 
2024 Q3
4
2 153 
1
1 551 
2024 Q2
3
1 979 
0
--- 
2024 Q1
3
2 342 
1
907 
2023 Q4
6
2 278 
0
--- 
2023 Q3
4
2 817 
0
--- 
2023 Q2
3
2 000 
0
--- 
2023 Q1
7
2 020 
0
--- 
2022 Q4
3
3 000 
1
1 111 
2022 Q3
2
1 970 
1
2 531 
2022 Q2
5
2 391 
0
--- 
2022 Q1
6
2 621 
0
--- 
2021 Q4
6
1 385 
0
--- 
2021 Q3
6
1 969 
0
--- 
2021 Q2
5
1 566 
1
1 471 
2021 Q1
3
1 457 
0
--- 
2020 Q4
6
1 093 
0
--- 
2020 Q3
4
1 828 
0
--- 
2020 Q2
3
1 296 
0
--- 
2020 Q1
1
2 828 
0
--- 
2019 Q4
6
1 474 
0
--- 
2019 Q3
8
1 476 
0
--- 
2019 Q2
6
1 354 
0
--- 
2019 Q1
4
1 522 
0
--- 
2018 Q4
4
1 516 
0
--- 
2018 Q3
4
1 446 
0
--- 
2018 Q2
1
474 
0
--- 
2018 Q1
2
1 222 
1
1 376 
2017 Q4
4
1 830 
0
--- 
2017 Q3
4
1 578 
0
--- 
2017 Q2
2
1 332 
1
948 
2017 Q1
2
1 912 
0
--- 
2016 Q4
2
1 520 
0
--- 
2016 Q3
4
1 842 
0
--- 
2016 Q2
5
1 329 
1
588 
2016 Q1
3
1 437 
0
--- 
2015 Q4
3
1 805 
0
--- 
2015 Q3
3
1 864 
1
565 
2015 Q2
0
--- 
1
1 368 
2015 Q1
4
858 
0
--- 
2014 Q4
2
1 633 
0
--- 
2014 Q3
2
876 
0
--- 
2014 Q2
3
1 635 
0
--- 
2014 Q1
1
1 901 
0
--- 

Ain (01)

Most expensive cities

City
name
Descending orderHouses
house
Price per m²
5 676 
5 576 
5 534 
5 509 
5 248 
5 159 
5 146 
City
name
Descending orderApartments
apt.
Price per m²
5 372 
5 062 
5 000 
4 942 
4 889 
4 836 
4 787 
4 691 

Least expensive cities

City
name
Ascending orderHouses
house
Price per m²
797 
808 
816 
893 
927 
958 
1 034 
1 046 
City
name
Ascending orderApartments
apt.
Price per m²
157 
174 
185 
217 
336 
349 
380 
421 
444