emooki
HomePrice mapTransactions
🇬🇧 English🇫🇷 Français🇩🇪 Deutsch🇪🇸 Español🇮🇹 Italiano

Real estate price map


Real estate price map in the municipality of Saint-Didier-sur-Chalaronne, choose a section to see transactions by parcel.

Ain (01)
Saint-Didier-sur-Chalaronne

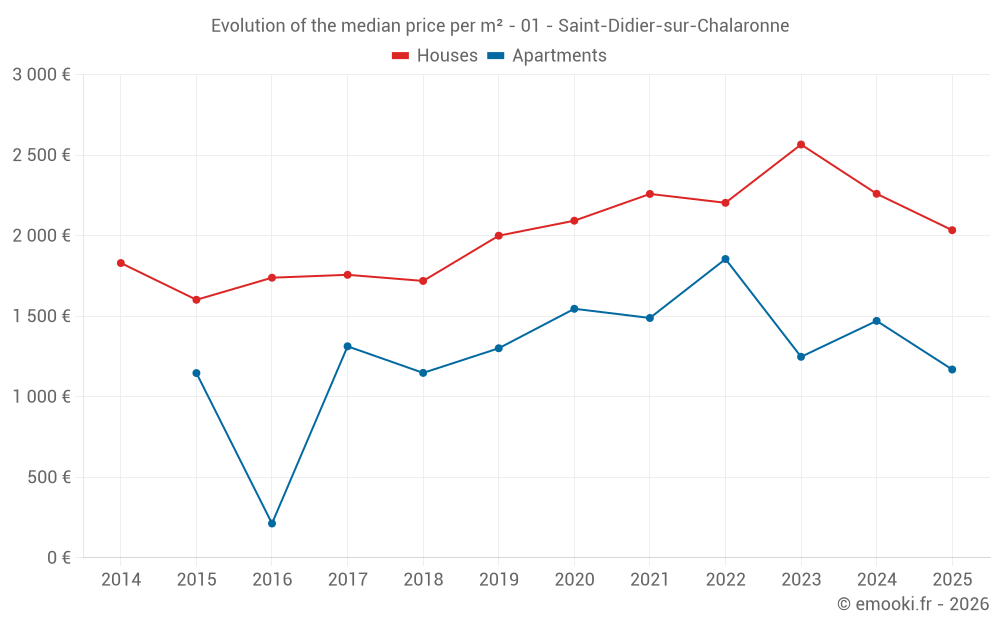
Median price of real estate
in the municipality of Saint-Didier-sur-Chalaronne

HousesHouses
2 062 € /m²
1-23-45-67-89-10
Reliability 8/10
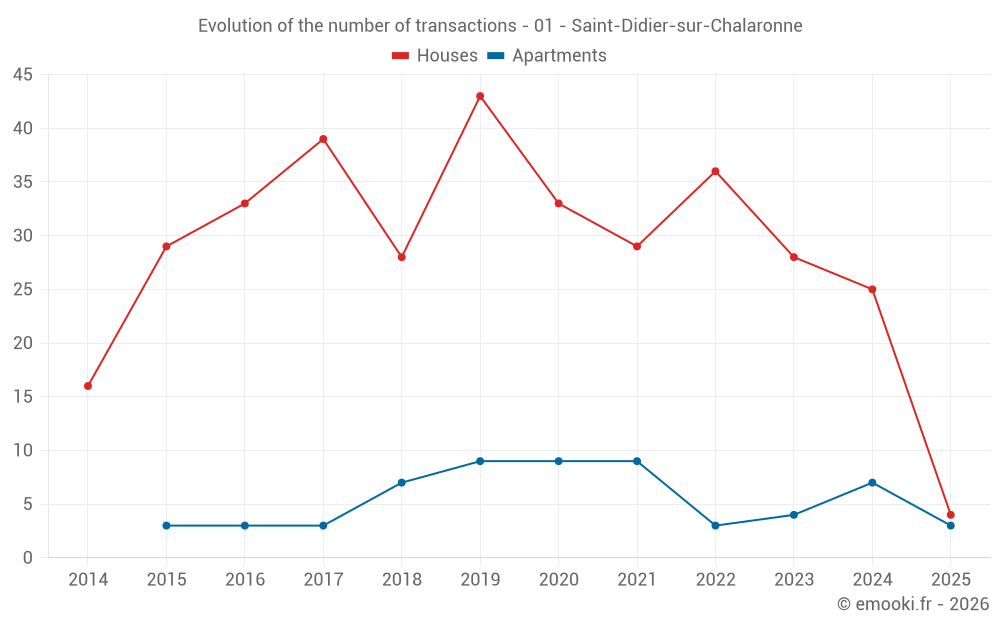
Median price on the 21 transactions of the last 12 months.
from 1 655 to
2 537 € /m²
60% of transactions from the 2nd to the 8th deciles.
ApartmentsApartments
1 424 € /m²
1-23-45-67-89-10
Reliability 6/10
Median price on the 16 transactions of the last 36 months.
from 1 169 to
1 797 € /m²
60% of transactions from the 2nd to the 8th deciles.
DwellingsDwellings
1 932 € /m²
1-23-45-67-89-10
Reliability 8/10
Median price on the 26 transactions of the last 12 months.
from 1 378 to
2 463 € /m²
60% of transactions from the 2nd to the 8th deciles.
HousesEvolution of the price per m² of houses since...
1 year
-10%
2 years
-21%
3 years
-7.7%
4 years
-10%
5 years
-2.8%
6 years
+1.7%
7 years
+18%
8 years
+16%
9 years
+17%
10 years
+27%
11 years
+11%
The price per m² of houses has decreased by 21% since 2 years, but it has increased by 27% in 10 years.

Yearly evolution

Evolution of the median price per m²

Evolution of the number of transactions

Warning, last year incomplete. Projections made based on the proportions between semesters of the previous year at the departmental/national level and by type of property.

Yearly data

Descending order
Year
Houses
house
transactions
Houses
house
Price per m²
Apartments
apt.
transactions
Apartments
apt.
Price per m²
2025
4
2 034 €
3
1 169 €
2024
25
2 260 €
7
1 471 €
2023
28
2 566 €
4
1 248 €
2022
36
2 204 €
3
1 855 €
2021
29
2 259 €
9
1 489 €
2020
33
2 093 €
9
1 546 €
2019
43
2 000 €
9
1 301 €
2018
28
1 719 €
7
1 148 €
2017
39
1 757 €
3
1 313 €
2016
33
1 739 €
3
213 €
2015
29
1 602 €
3
1 147 €
2014
16
1 830 €
0
--- €

Analysis

Structure of prices per m²

Values of price percentiles per m² over the periods used for the estimated price of each type of property.

Structure of transaction amounts

Values of transaction amounts percentiles over the periods used for the estimated price of each type of property.

Transaction amounts and prices per m² by percentile

Ascending order
Percentile
Houses
house
Price per m²
Houses
house
Transaction amount
Apartments
apt.
Price per m²
Apartments
apt.
Transaction amount
10th percentile
1 455 €
114 K€
1 026 €
51 500 €
20th percentile
1 655 €
165 K€
1 169 €
70 000 €
30th percentile
1 815 €
170 K€
1 202 €
89 500 €
40th percentile
1 988 €
240 K€
1 292 €
115 K€
50th percentile
2 062 €
248 K€
1 424 €
120 K€
60th percentile
2 260 €
258 K€
1 514 €
128 K€
70th percentile
2 315 €
300 K€
1 661 €
129 K€
80th percentile
2 537 €
334 K€
1 797 €
135 K€
90th percentile
2 681 €
358 K€
1 870 €
184 K€

National and departmental comparison

Evolution of the median price per m² of houses

Evolution of the median price per m² of apartments

Quarterly evolution

Evolution of the median price per m²

Evolution of the number of transactions

Quarterly data

Descending order
Quarter
Houses
house
transactions
Houses
house
Price per m²
Apartments
apt.
transactions
Apartments
apt.
Price per m²
2025 Q2
1
1 694 €
0
--- €
2025 Q1
3
2 252 €
3
1 169 €
2024 Q4
9
2 260 €
0
--- €
2024 Q3
8
2 025 €
2
1 288 €
2024 Q2
4
2 498 €
2
1 656 €
2024 Q1
4
1 746 €
3
1 471 €
2023 Q4
3
2 467 €
1
2 367 €
2023 Q3
8
2 830 €
2
1 179 €
2023 Q2
9
2 375 €
1
1 205 €
2023 Q1
8
2 890 €
0
--- €
2022 Q4
8
2 523 €
0
--- €
2022 Q3
10
2 548 €
2
1 870 €
2022 Q2
6
2 588 €
1
1 623 €
2022 Q1
12
1 622 €
0
--- €
2021 Q4
6
2 446 €
3
1 930 €
2021 Q3
12
2 410 €
2
1 540 €
2021 Q2
5
1 574 €
1
1 174 €
2021 Q1
6
2 236 €
3
1 489 €
2020 Q4
9
2 073 €
4
1 538 €
2020 Q3
11
2 390 €
1
1 611 €
2020 Q2
6
2 179 €
1
1 971 €
2020 Q1
7
1 516 €
3
1 317 €
2019 Q4
12
2 110 €
1
1 482 €
2019 Q3
16
2 078 €
5
1 081 €
2019 Q2
7
2 524 €
2
1 216 €
2019 Q1
8
1 750 €
1
1 382 €
2018 Q4
5
1 618 €
0
--- €
2018 Q3
9
1 923 €
0
--- €
2018 Q2
8
1 410 €
3
1 082 €
2018 Q1
6
2 134 €
4
1 244 €
2017 Q4
10
1 776 €
0
--- €
2017 Q3
11
1 757 €
0
--- €
2017 Q2
7
1 445 €
1
1 419 €
2017 Q1
11
1 854 €
2
1 102 €
2016 Q4
9
1 959 €
0
--- €
2016 Q3
9
1 773 €
0
--- €
2016 Q2
9
1 620 €
2
352 €
2016 Q1
6
1 757 €
1
213 €
2015 Q4
5
1 602 €
0
--- €
2015 Q3
11
1 809 €
1
1 446 €
2015 Q2
9
1 489 €
1
1 147 €
2015 Q1
4
1 524 €
1
8 €
2014 Q4
2
1 274 €
0
--- €
2014 Q3
7
1 752 €
0
--- €
2014 Q2
5
1 909 €
0
--- €
2014 Q1
2
1 535 €
0
--- €

Overview of the latest real estate transactions

The following list is an anonymized overview of the latest transactions. For more details and to find all transactions, please use the map to view transactions by plot or the transaction search page for a search by criteria.

2025-06-03
2 268 €
Sale
Land
54 m2
-Terres
2025-05-27
257 500 €
1 694 € /m²(152 m²)
Sale
1 outbuilding
Land
41 m2
-Sols
Houses
House
5 rooms
152 m2
Land
327 m2
-Sols
Land
852 m2
-Jardins
Land
6 m2
-Sols
2025-05-26
89 500 €
Sale
Land
420 m2
-Terrains à bâtir
2025-04-15
69 856 €
Sale
Land
180 m2
-Eaux
/Mare
Land
2003 m2
-Prés
2025-04-14
800 €
Exchange
Land
1080 m2
-Vergers
Land
1085 m2
-Terres
2025-04-08
2 000 €
Sale
Land
5870 m2
-Taillis sous futaie
/Acacias
2025-03-31
165 000 €
Sale
Land
115 m2
-Sols
2025-03-18
3 075 €
Sale
Land
12300 m2
-Terres
2025-03-11
90 000 €
1 169 € /m²(77 m²)
Sale
Apartments
Apartment
3 rooms
77 m2
1 outbuilding
2025-02-28
358 070 €
2 252 € /m²(159 m²)
Sale
Houses
House
5 rooms
159 m2
Land
886 m2
-Sols
Land
451 m2
-Jardins
Land
310 m2
-Jardins
2025-02-27
1 €
Sale
Land
9 m2
-Sols
2025-02-17
120 000 €
176 € /m²(680 m²)
Sale
Commercial property
680 m2
Land
1227 m2
-Sols
Land
546 m2
-Jardins
/Pré marais
2025-01-30
285 000 €
1 815 € /m²(157 m²)
Sale
Houses
House
5 rooms
157 m2
Land
927 m2
-Sols
2025-01-30
200 000 €
Sale
1 outbuilding
Land
703 m2
-Sols
Land
1138 m2
-Jardins
Land
171 m2
-Sols
2025-01-29
8 000 €
Sale
2025-01-29
128 130 €
1 643 € /m²(78 m²)
Sale
Apartments
Apartment
4 rooms
78 m2
2 outbuildings
2025-01-17
45 000 €
938 € /m²(48 m²)
Sale
1 outbuilding
Apartments
Apartment
2 rooms
48 m2
1 outbuilding
2025-01-15
95 000 €
Sale
Land
500 m2
-Terrains à bâtir
2025-01-10
175 000 €
2 273 € /m²(77 m²)
Sale
Houses
House
4 rooms
77 m2
1 outbuilding
Land
1345 m2
-Sols
2025-01-09
128 100 €
Sale
Land
185 m2
-Terres
Land
1012 m2
-Terres
Land
633 m2
-Prés
762 transactions listed in the municipality

Ain (01)

Most expensive cities

City
name
Descending orderHouses
house
Price per m²
6 836 €
5 676 €
5 576 €
5 534 €
5 509 €
5 298 €
5 248 €
5 234 €
5 159 €
5 146 €
City
name
Descending orderApartments
apt.
Price per m²
6 178 €
5 372 €
5 332 €
5 062 €
5 000 €
4 942 €
4 889 €
4 836 €
4 787 €
4 691 €

Least expensive cities

City
name
Ascending orderHouses
house
Price per m²
797 €
808 €
816 €
893 €
894 €
927 €
958 €
1 034 €
1 038 €
1 046 €
City
name
Ascending orderApartments
apt.
Price per m²
157 €
174 €
185 €
217 €
336 €
349 €
380 €
421 €
444 €