emooki
HomePrice mapTransactions
🇬🇧 English🇫🇷 Français🇩🇪 Deutsch🇪🇸 Español🇮🇹 Italiano

Real estate price map


Real estate price map in the municipality of Saint-Denis-lès-Bourg.

Ain (01)
Saint-Denis-lès-Bourg

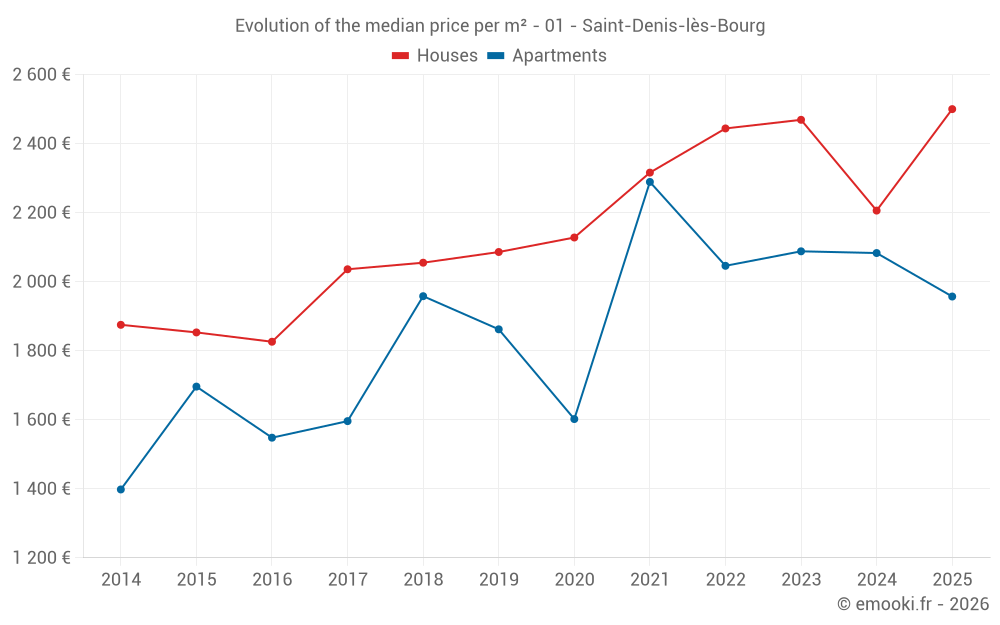
Median price of real estate
in the municipality of Saint-Denis-lès-Bourg

HousesHouses
2 346  /m²
1-23-45-67-89-10
Reliability 8/10
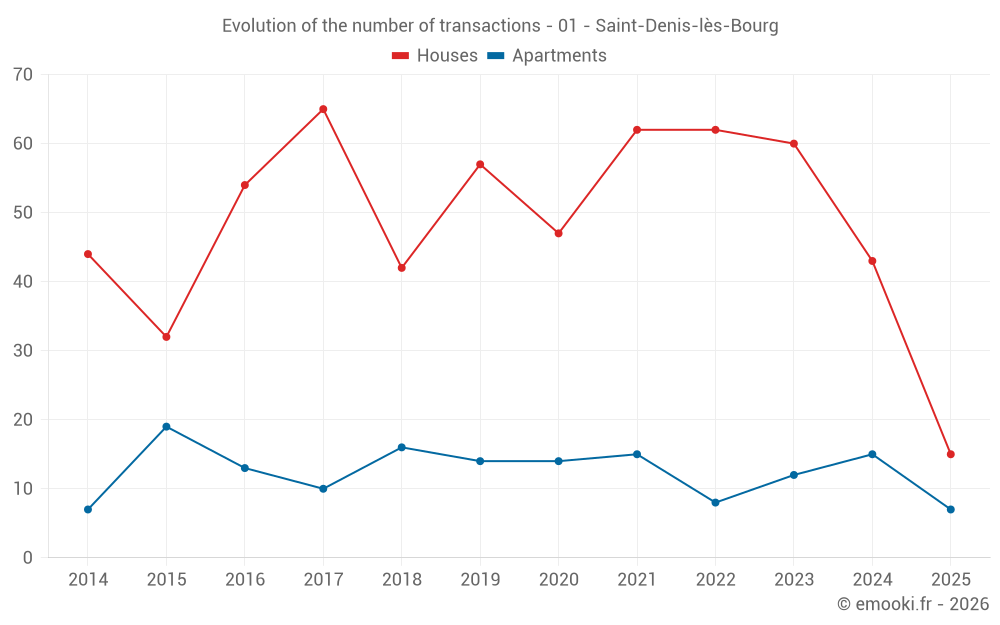
Median price on the 38 transactions of the last 12 months.
from 1 706 to
2 658  /m²
60% of transactions from the 2nd to the 8th deciles.
ApartmentsApartments
1 949  /m²
1-23-45-67-89-10
Reliability 8/10
Median price on the 16 transactions of the last 12 months.
from 1 564 to
2 288  /m²
60% of transactions from the 2nd to the 8th deciles.
DwellingsDwellings
2 336  /m²
1-23-45-67-89-10
Reliability 9/10
Median price on the 22 transactions of the last 6 months.
from 1 908 to
2 678  /m²
60% of transactions from the 2nd to the 8th deciles.
HousesEvolution of the price per m² of houses since...
1 year
+13%
2 years
+1.3%
3 years
+2.3%
4 years
+7.9%
5 years
+17%
6 years
+20%
7 years
+22%
8 years
+23%
9 years
+37%
10 years
+35%
11 years
+33%
ApartmentsEvolution of the price per m² of apartments since...
1 year
-6%
2 years
-6.3%
3 years
-4.3%
4 years
-15%
5 years
+22%
6 years
+5.1%
7 years
-0.1%
8 years
+23%
9 years
+26%
10 years
+15%
11 years
+40%

Yearly evolution

Evolution of the median price per m²

Evolution of the number of transactions

Warning, last year incomplete. Projections made based on the proportions between semesters of the previous year at the departmental/national level and by type of property.

Yearly data

Descending order
Year
Houses
house
transactions
Houses
house
Price per m²
Apartments
apt.
transactions
Apartments
apt.
Price per m²
2025
15
2 500 
7
1 957 
2024
43
2 206 
15
2 083 
2023
60
2 469 
12
2 088 
2022
62
2 444 
8
2 046 
2021
62
2 316 
15
2 289 
2020
47
2 128 
14
1 602 
2019
57
2 086 
14
1 862 
2018
42
2 055 
16
1 958 
2017
65
2 036 
10
1 596 
2016
54
1 826 
13
1 548 
2015
32
1 853 
19
1 696 
2014
44
1 875 
7
1 398 

Analysis

Structure of prices per m²

Values of price percentiles per m² over the periods used for the estimated price of each type of property.

Structure of transaction amounts

Values of transaction amounts percentiles over the periods used for the estimated price of each type of property.

Transaction amounts and prices per m² by percentile

Ascending order
Percentile
Houses
house
Price per m²
Houses
house
Transaction amount
Apartments
apt.
Price per m²
Apartments
apt.
Transaction amount
10th percentile
1 360 
183 K
1 194 
98 500 
20th percentile
1 706 
195 K
1 564 
110 K
30th percentile
1 994 
207 K
1 725 
114 K
40th percentile
2 175 
224 K
1 869 
143 K
50th percentile
2 346 
234 K
1 949 
155 K
60th percentile
2 433 
249 K
2 083 
165 K
70th percentile
2 587 
279 K
2 178 
173 K
80th percentile
2 658 
288 K
2 288 
180 K
90th percentile
2 891 
344 K
2 342 
193 K

National and departmental comparison

Evolution of the median price per m² of houses

Evolution of the median price per m² of apartments

Quarterly evolution

Evolution of the median price per m²

Evolution of the number of transactions

Quarterly data

Descending order
Quarter
Houses
house
transactions
Houses
house
Price per m²
Apartments
apt.
transactions
Apartments
apt.
Price per m²
2025 Q2
3
2 588 
3
1 957 
2025 Q1
12
2 462 
4
2 116 
2024 Q4
14
2 448 
5
2 083 
2024 Q3
9
2 167 
4
1 818 
2024 Q2
6
2 186 
4
2 383 
2024 Q1
14
2 263 
2
2 396 
2023 Q4
14
2 417 
4
1 942 
2023 Q3
16
2 514 
3
2 847 
2023 Q2
14
2 331 
4
2 156 
2023 Q1
16
2 548 
1
1 299 
2022 Q4
18
2 695 
1
2 503 
2022 Q3
20
2 492 
4
1 708 
2022 Q2
12
2 323 
2
2 301 
2022 Q1
12
2 060 
1
2 849 
2021 Q4
13
2 564 
5
2 409 
2021 Q3
24
2 314 
2
2 311 
2021 Q2
16
2 066 
2
2 137 
2021 Q1
9
2 347 
6
1 890 
2020 Q4
11
2 035 
6
1 317 
2020 Q3
16
2 202 
3
2 103 
2020 Q2
10
2 140 
1
1 719 
2020 Q1
10
2 132 
4
1 758 
2019 Q4
15
2 131 
3
1 595 
2019 Q3
14
2 143 
7
1 953 
2019 Q2
12
1 913 
2
1 710 
2019 Q1
16
2 090 
2
1 612 
2018 Q4
12
2 019 
1
1 572 
2018 Q3
10
1 910 
3
2 177 
2018 Q2
10
2 067 
5
1 812 
2018 Q1
10
2 176 
7
2 081 
2017 Q4
13
2 036 
1
1 894 
2017 Q3
21
2 186 
2
1 329 
2017 Q2
22
1 985 
2
1 510 
2017 Q1
9
1 837 
5
2 360 
2016 Q4
20
2 044 
4
1 981 
2016 Q3
14
1 895 
7
1 542 
2016 Q2
12
1 604 
1
1 224 
2016 Q1
8
1 986 
1
1 675 
2015 Q4
7
1 988 
5
1 600 
2015 Q3
11
1 845 
5
1 723 
2015 Q2
10
1 920 
7
1 691 
2015 Q1
4
1 784 
2
2 116 
2014 Q4
11
2 045 
1
1 398 
2014 Q3
12
1 857 
5
1 359 
2014 Q2
10
1 888 
0
--- 
2014 Q1
11
1 829 
1
1 735 

Ain (01)

Most expensive cities

City
name
Descending orderHouses
house
Price per m²
5 676 
5 576 
5 534 
5 509 
5 248 
5 159 
5 146 
City
name
Descending orderApartments
apt.
Price per m²
5 372 
5 062 
5 000 
4 942 
4 889 
4 836 
4 787 
4 691 

Least expensive cities

City
name
Ascending orderHouses
house
Price per m²
797 
808 
816 
893 
927 
958 
1 034 
1 046 
City
name
Ascending orderApartments
apt.
Price per m²
157 
174 
185 
217 
336 
349 
380 
421 
444