emooki

Real estate price map


Real estate price map in the municipality of Buellas, choose a section to see transactions by parcel.

Ain (01)

Price per m² in Buellas

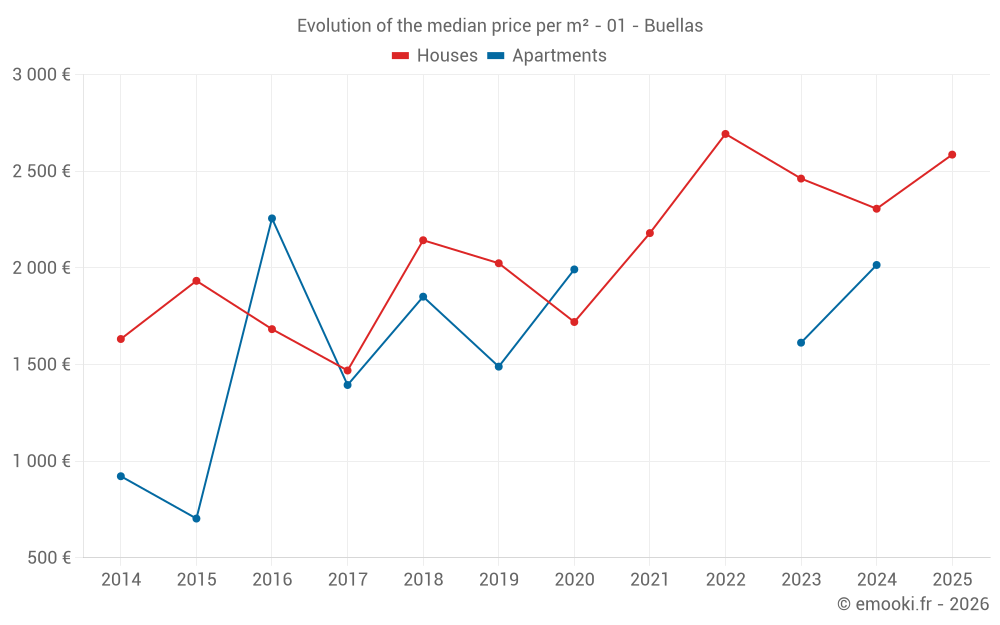
Median price of real estate
in the municipality of Buellas

HousesHouses
2 398  /m²
1-23-45-67-89-10
Reliability 7/10
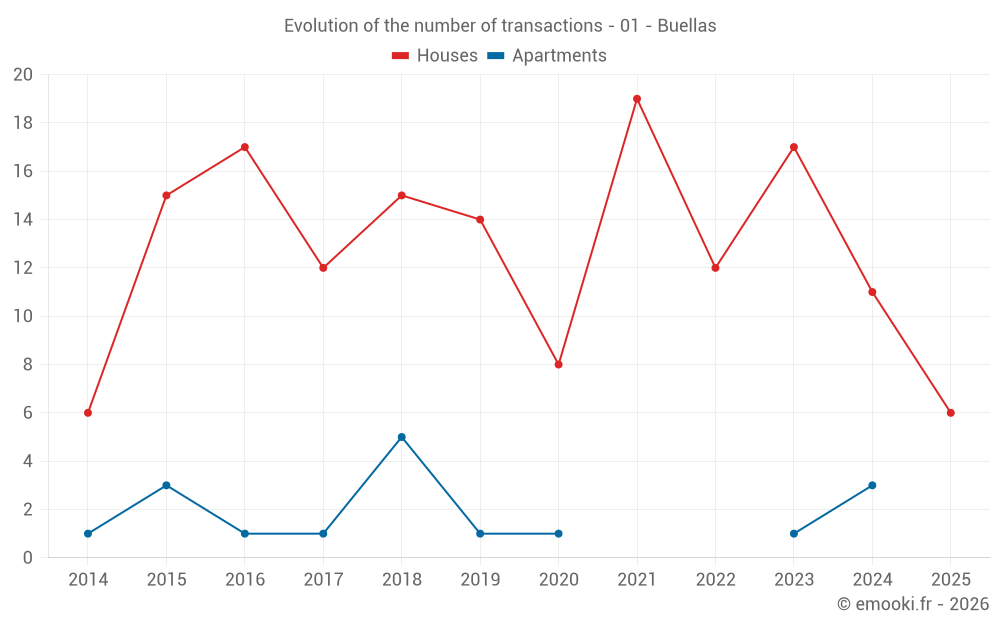
Median price on the 26 transactions of the last 24 months.
from 1 966 to
2 813  /m²
60% of transactions from the 2nd to the 8th deciles.
ApartmentsApartments
1 802  /m²
1-23-45-67-89-10
Reliability 3/10
Median price on the 6 transactions of the last 72 months.
DwellingsDwellings
2 398  /m²
1-23-45-67-89-10
Reliability 8/10
Median price on the 16 transactions of the last 12 months.
from 2 015 to
2 813  /m²
60% of transactions from the 2nd to the 8th deciles.
HousesEvolution of the price per m² of houses since...
1 year
+12%
2 years
+5%
3 years
-4%
4 years
+19%
5 years
+50%
6 years
+28%
7 years
+21%
8 years
+76%
9 years
+54%
10 years
+34%
11 years
+58%
The price per m² of houses has decreased by 4% since 3 years, but it has increased by 76% in 8 years.

309 transactions listed in the municipality

Yearly data

Yearly evolution of the median price per m²

Yearly evolution of the median price per m² - 01 - Buellas

Yearly evolution of the number of transactions

Warning, last year incomplete. Projections made based on the proportions between semesters of the previous year at the departmental/national level and by type of property.

Yearly evolution of the number of transactions - 01 - Buellas

Yearly table

Descending order
Year
Houses
house
transactions
Houses
house
Price per m²
Apartments
apt.
transactions
Apartments
apt.
Price per m²
2025
6
2 586 
0
--- 
2024
11
2 306 
3
2 015 
2023
17
2 462 
1
1 613 
2022
12
2 693 
0
--- 
2021
19
2 180 
0
--- 
2020
8
1 720 
1
1 992 
2019
14
2 024 
1
1 489 
2018
15
2 143 
5
1 851 
2017
12
1 469 
1
1 394 
2016
17
1 683 
1
2 256 
2015
15
1 933 
3
703 
2014
6
1 632 
1
922 

Analysis

Structure of prices per m²

Values of price percentiles per m² over the periods used for the estimated price of each type of property.

Structure of transaction amounts

Values of transaction amounts percentiles over the periods used for the estimated price of each type of property.

Transaction amounts and prices per m² by percentile

Ascending order
Percentile
Houses
house
Price per m²
Houses
house
Transaction amount
Apartments
apt.
Price per m²
Apartments
apt.
Transaction amount
10th percentile
1 407 
204 K
1 282 
130 K
20th percentile
1 966 
230 K
1 489 
133 K
30th percentile
2 013 
242 K
1 551 
137 K
40th percentile
2 236 
250 K
1 613 
140 K
50th percentile
2 398 
258 K
1 802 
170 K
60th percentile
2 577 
279 K
1 992 
200 K
70th percentile
2 678 
312 K
2 004 
225 K
80th percentile
2 813 
360 K
2 015 
250 K
90th percentile
3 022 
381 K
2 338 
300 K

National and departmental comparison

Evolution of the median price per m² of houses

Evolution of the median price per m² of apartments

Quarterly data

Quarterly evolution of the median price per m²

Quarterly evolution of the number of transactions

Quarterly table

Descending order
Quarter
Houses
house
transactions
Houses
house
Price per m²
Apartments
apt.
transactions
Apartments
apt.
Price per m²
2025 Q2
1
2 594 
0
--- 
2025 Q1
5
2 579 
0
--- 
2024 Q4
2
2 094 
3
2 015 
2024 Q3
5
2 374 
0
--- 
2024 Q1
4
2 332 
0
--- 
2023 Q4
5
1 996 
0
--- 
2023 Q3
4
2 364 
0
--- 
2023 Q2
2
2 419 
0
--- 
2023 Q1
6
2 468 
1
1 613 
2022 Q4
3
2 770 
0
--- 
2022 Q3
3
2 274 
0
--- 
2022 Q2
5
2 963 
0
--- 
2022 Q1
1
2 692 
0
--- 
2021 Q4
5
2 745 
0
--- 
2021 Q3
8
2 118 
0
--- 
2021 Q2
1
2 006 
0
--- 
2021 Q1
5
2 322 
0
--- 
2020 Q4
2
1 934 
0
--- 
2020 Q3
1
1 162 
0
--- 
2020 Q2
2
1 874 
1
1 992 
2020 Q1
3
1 665 
0
--- 
2019 Q4
5
2 110 
1
1 489 
2019 Q3
8
1 931 
0
--- 
2019 Q2
1
1 023 
0
--- 
2018 Q4
8
2 282 
2
1 574 
2018 Q3
3
1 406 
2
2 037 
2018 Q2
2
1 955 
0
--- 
2018 Q1
2
2 284 
1
2 188 
2017 Q4
4
1 952 
1
1 394 
2017 Q3
2
996 
0
--- 
2017 Q2
2
1 279 
0
--- 
2017 Q1
4
1 166 
0
--- 
2016 Q4
4
1 800 
0
--- 
2016 Q3
4
1 837 
0
--- 
2016 Q2
6
1 674 
0
--- 
2016 Q1
3
2 015 
1
2 256 
2015 Q4
4
2 066 
0
--- 
2015 Q3
7
1 933 
0
--- 
2015 Q2
2
1 432 
1
703 
2015 Q1
2
1 564 
2
948 
2014 Q3
2
1 300 
0
--- 
2014 Q2
1
1 690 
0
--- 
2014 Q1
3
1 721 
1
922 

Key takeaways

  • QuestionWhat is the price per m2 of houses in Buellas?

    The median price on the 26 house transactions of the last 24 months in the municipality of Buellas was 2 398 € per square meter for a median property value of 258 325 €. Over this period, 60% of transactions were between 1 966 and 2 813 € per square meter (from the 2nd to the 8th deciles).

Compare with neighboring municipalities

City
name
Descending orderHouses
house
Price per m²
Apartments
apt.
Price per m²
2 496 
1 067 
2 462 
1 313 
2 398 
1 802 
2 389 
1 987 
2 374 
1 038 
2 357 
1 692 
2 346 
1 949 
2 304 
790 
2 252 
1 389 
2 218 
--- 

City information

Zip codes

  • 01310 BUELLAS
  • CORGENON 01310 BUELLAS