emooki
HomePrice mapTransactions
🇬🇧 English🇫🇷 Français🇩🇪 Deutsch🇪🇸 Español🇮🇹 Italiano

Real estate price map


Real estate price map in the municipality of Beynost, choose a section to see transactions by parcel.

Ain (01)

Beynost - Real estate price m²

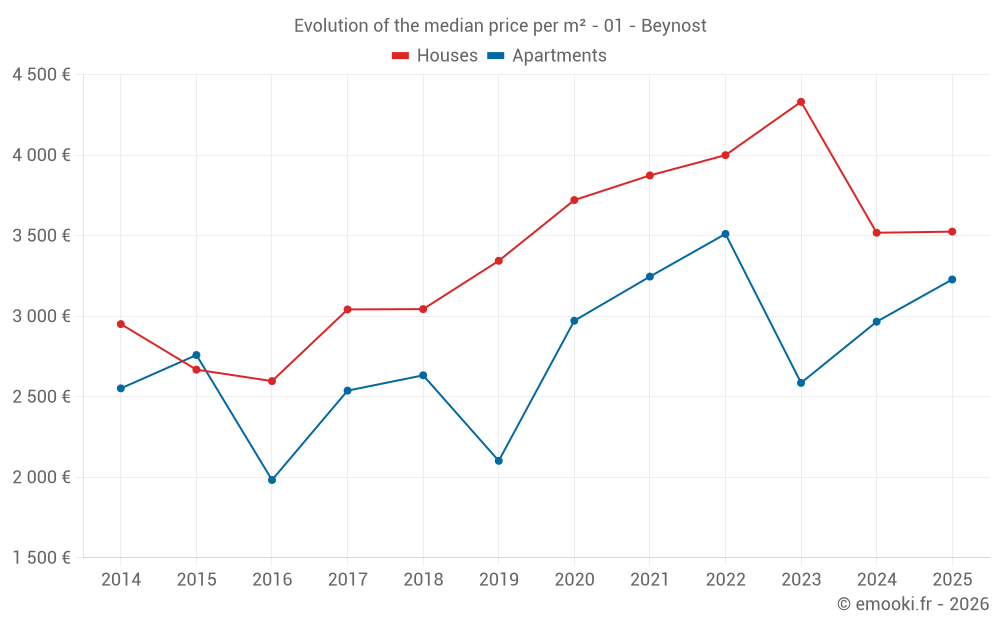
Median price of real estate
in the municipality of Beynost

HousesHouses
3 525  /m²
1-23-45-67-89-10
Reliability 8/10
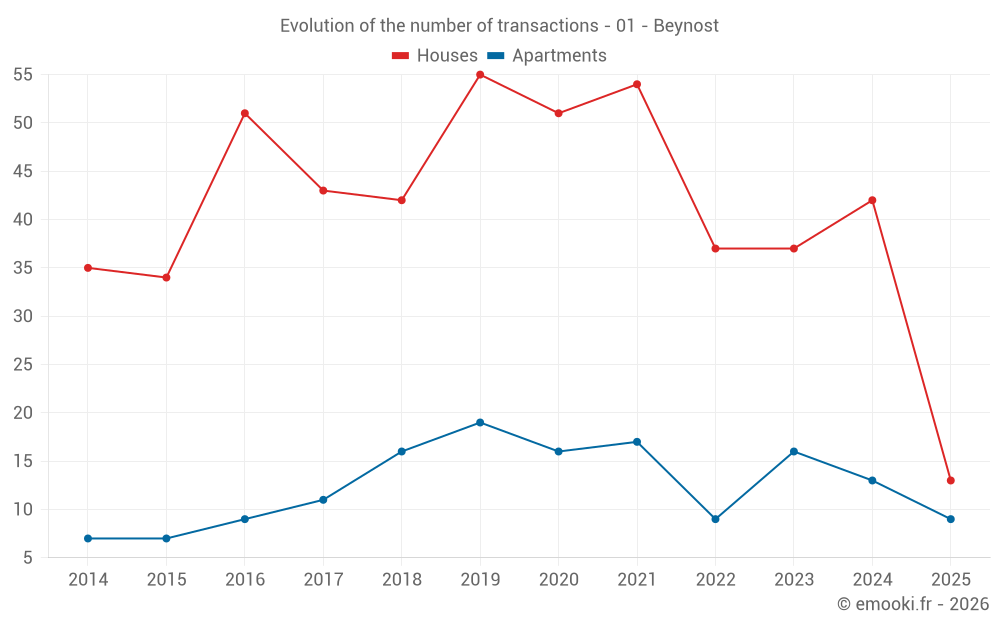
Median price on the 41 transactions of the last 12 months.
from 2 385 to
4 167  /m²
60% of transactions from the 2nd to the 8th deciles.
ApartmentsApartments
3 252  /m²
1-23-45-67-89-10
Reliability 8/10
Median price on the 16 transactions of the last 12 months.
from 2 898 to
4 042  /m²
60% of transactions from the 2nd to the 8th deciles.
DwellingsDwellings
3 516  /m²
1-23-45-67-89-10
Reliability 9/10
Median price on the 22 transactions of the last 6 months.
from 2 456 to
4 152  /m²
60% of transactions from the 2nd to the 8th deciles.
HousesEvolution of the price per m² of houses since...
1 year
+0.2%
2 years
-19%
3 years
-12%
4 years
-9%
5 years
-5.3%
6 years
+5.4%
7 years
+16%
8 years
+16%
9 years
+36%
10 years
+32%
11 years
+19%
The price per m² of houses has decreased by 19% since 2 years, but it has increased by 36% in 9 years.
ApartmentsEvolution of the price per m² of apartments since...
1 year
+8.8%
2 years
+25%
3 years
-8.1%
4 years
-0.6%
5 years
+8.6%
6 years
+54%
7 years
+23%
8 years
+27%
9 years
+63%
10 years
+17%
11 years
+26%
The price per m² of apartments has decreased by 8.1% since 3 years, but it has increased by 63% in 9 years.

Yearly evolution

Evolution of the median price per m²

Evolution of the median price per m² - 01 - Beynost

Evolution of the number of transactions

Warning, last year incomplete. Projections made based on the proportions between semesters of the previous year at the departmental/national level and by type of property.

Evolution of the number of transactions - 01 - Beynost

Yearly data

Descending order
Year
Houses
house
transactions
Houses
house
Price per m²
Apartments
apt.
transactions
Apartments
apt.
Price per m²
2025
13
3 525 
9
3 228 
2024
42
3 518 
13
2 966 
2023
37
4 331 
16
2 586 
2022
37
4 000 
9
3 511 
2021
54
3 874 
17
3 246 
2020
51
3 721 
16
2 972 
2019
55
3 344 
19
2 102 
2018
42
3 044 
16
2 633 
2017
43
3 042 
11
2 538 
2016
51
2 597 
9
1 983 
2015
34
2 668 
7
2 759 
2014
35
2 951 
7
2 552 

Analysis

Structure of prices per m²

Values of price percentiles per m² over the periods used for the estimated price of each type of property.

Structure of transaction amounts

Values of transaction amounts percentiles over the periods used for the estimated price of each type of property.

Transaction amounts and prices per m² by percentile

Ascending order
Percentile
Houses
house
Price per m²
Houses
house
Transaction amount
Apartments
apt.
Price per m²
Apartments
apt.
Transaction amount
10th percentile
2 081 
260 K
2 278 
134 K
20th percentile
2 385 
316 K
2 898 
190 K
30th percentile
2 917 
359 K
2 918 
202 K
40th percentile
3 274 
385 K
2 966 
235 K
50th percentile
3 525 
423 K
3 252 
253 K
60th percentile
3 821 
450 K
3 646 
268 K
70th percentile
4 036 
475 K
3 784 
274 K
80th percentile
4 167 
610 K
4 042 
285 K
90th percentile
4 799 
705 K
4 386 
345 K

National and departmental comparison

Evolution of the median price per m² of houses

Evolution of the median price per m² of apartments

Quarterly evolution

Evolution of the median price per m²

Evolution of the number of transactions

Quarterly data

Descending order
Quarter
Houses
house
transactions
Houses
house
Price per m²
Apartments
apt.
transactions
Apartments
apt.
Price per m²
2025 Q2
1
3 525 
5
3 730 
2025 Q1
12
3 664 
4
3 076 
2024 Q4
14
3 879 
3
2 913 
2024 Q3
14
2 934 
4
3 844 
2024 Q2
4
3 639 
3
1 786 
2024 Q1
10
3 764 
3
3 089 
2023 Q4
9
4 318 
2
3 172 
2023 Q3
6
4 570 
2
2 992 
2023 Q2
10
3 882 
4
2 480 
2023 Q1
12
4 630 
8
2 754 
2022 Q4
10
3 918 
2
2 927 
2022 Q3
14
4 117 
3
3 511 
2022 Q2
6
3 958 
3
3 602 
2022 Q1
7
3 860 
1
4 177 
2021 Q4
13
4 124 
3
2 477 
2021 Q3
14
3 379 
5
3 246 
2021 Q2
15
3 422 
7
3 433 
2021 Q1
12
3 582 
2
2 582 
2020 Q4
8
3 760 
4
2 874 
2020 Q3
19
3 721 
4
2 918 
2020 Q2
17
3 640 
5
2 941 
2020 Q1
7
3 763 
3
3 108 
2019 Q4
9
3 189 
5
3 521 
2019 Q3
16
3 239 
11
2 012 
2019 Q2
17
3 518 
3
1 737 
2019 Q1
13
3 254 
0
--- 
2018 Q4
14
3 174 
4
2 950 
2018 Q3
7
3 514 
4
2 458 
2018 Q2
12
2 283 
4
2 758 
2018 Q1
9
3 039 
4
1 738 
2017 Q4
8
3 377 
0
--- 
2017 Q3
17
3 123 
1
2 470 
2017 Q2
6
2 333 
4
2 706 
2017 Q1
12
2 680 
6
2 630 
2016 Q4
16
2 796 
3
2 954 
2016 Q3
10
2 939 
1
1 983 
2016 Q2
13
2 197 
4
1 838 
2016 Q1
12
2 484 
1
1 859 
2015 Q4
10
2 324 
1
2 794 
2015 Q3
13
2 831 
4
2 712 
2015 Q2
4
3 396 
1
2 844 
2015 Q1
7
2 363 
1
2 600 
2014 Q4
13
2 951 
3
2 552 
2014 Q3
12
3 178 
1
2 072 
2014 Q2
7
2 479 
2
2 915 
2014 Q1
3
2 675 
1
1 852 

Overview of the latest real estate transactions

The following list is an anonymized overview of the latest transactions. For more details and to find all transactions, please use the map to view transactions by plot or the transaction search page for a search by criteria.

2025-05-26
199 950 
2 898  /m²(69 m²)
Sale
Apartments
Apartment
4 rooms
69 m2
3 outbuildings
2025-05-23
35 000 
Sale
Land
504 m2
-Prés
Land
240 m2
-Terrains à bâtir
Land
2643 m2
-Prés
Land
3408 m2
-Prés
2025-05-05
241 610 
4 239  /m²(57 m²)
Sale
2 outbuildings
Apartments
Apartment
3 rooms
57 m2
2025-04-30
235 000 
3 730  /m²(63 m²)
Sale
Apartments
Apartment
3 rooms
63 m2
1 outbuilding
2025-04-24
69 000 
1 917  /m²(36 m²)
Sale
Apartments
Apartment
1 room
36 m2
2025-04-17
5 000 
Sale
Land
2060 m2
-Sols
2025-04-16
430 000 
3 525  /m²(122 m²)
Sale
Houses
House
5 rooms
122 m2
Land
868 m2
-Terrains d'agrément
Land
500 m2
-Sols
Land
192 m2
-Sols
2025-04-16
203 350 
3 837  /m²(53 m²)
Sale
Apartments
Apartment
2 rooms
53 m2
3 outbuildings
2025-04-08
460 000 
Sale
Land
451 m2
-Terrains à bâtir
2025-04-02
210 000 
Sale
Land
644 m2
-Sols
2025-03-27
178 000 
Sale
Land
108 m2
-Sols
Land
13 m2
-Sols
2025-03-27
205 000 
Sale
Land
67 m2
-Sols
Land
683 m2
-Terrains d'agrément
2025-03-24
360 400 
2 184  /m²(165 m²)
Sale
Houses
House
5 rooms
165 m2
Land
497 m2
-Sols
Land
18 m2
-Sols
2025-03-18
184 000 
3 228  /m²(57 m²)
Sale
Apartments
Apartment
3 rooms
57 m2
3 outbuildings
2025-03-18
7 900 
Sale
Land
79 m2
-Sols
2025-03-17
350 000 
4 605  /m²(76 m²)
Exchange
Houses
House
3 rooms
76 m2
1 outbuilding
Land
917 m2
-Sols
2025-03-17
84 450 
1 656  /m²(51 m²)
Sale
Apartments
Apartment
2 rooms
51 m2
1 outbuilding
2025-03-14
470 000 
3 310  /m²(142 m²)
Sale
Houses
House
4 rooms
142 m2
Land
419 m2
-Sols
Land
627 m2
-Sols
2025-03-12
120 000 
Sale
6 outbuildings
2025-03-12
662 150 
4 764  /m²(139 m²)
Sale
Houses
House
4 rooms
139 m2
Land
831 m2
-Sols
1215 transactions listed in the municipality

Ain (01)

Most expensive cities

City
name
Descending orderHouses
house
Price per m²
5 676 
5 576 
5 534 
5 509 
5 248 
5 159 
5 146 
City
name
Descending orderApartments
apt.
Price per m²
5 372 
5 062 
5 000 
4 942 
4 889 
4 836 
4 787 
4 691 

Least expensive cities

City
name
Ascending orderHouses
house
Price per m²
797 
808 
816 
893 
927 
958 
1 034 
1 046 
City
name
Ascending orderApartments
apt.
Price per m²
157 
174 
185 
217 
336 
349 
380 
421 
444