emooki
SearchPrice mapTransactions
🇬🇧 English🇫🇷 Français🇩🇪 Deutsch🇪🇸 Español🇮🇹 Italiano

Real estate price map


Real estate price map in the municipality of Attignat.

Ain (01)
Attignat

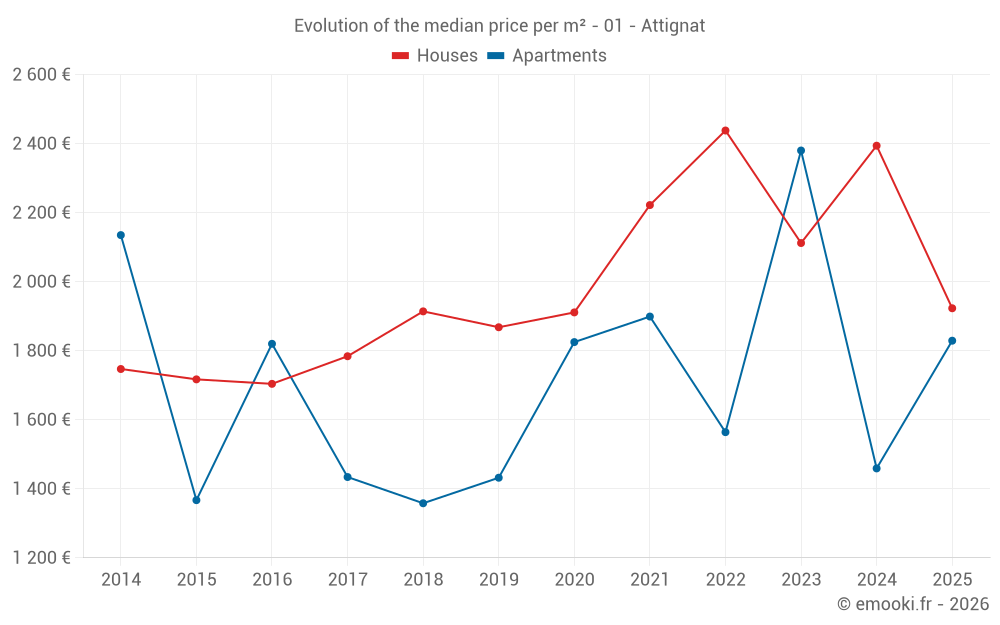
Median price of real estate
in the municipality of Attignat

HousesHouses
1 964 € /m²
1-23-45-67-89-10
Reliability 8/10
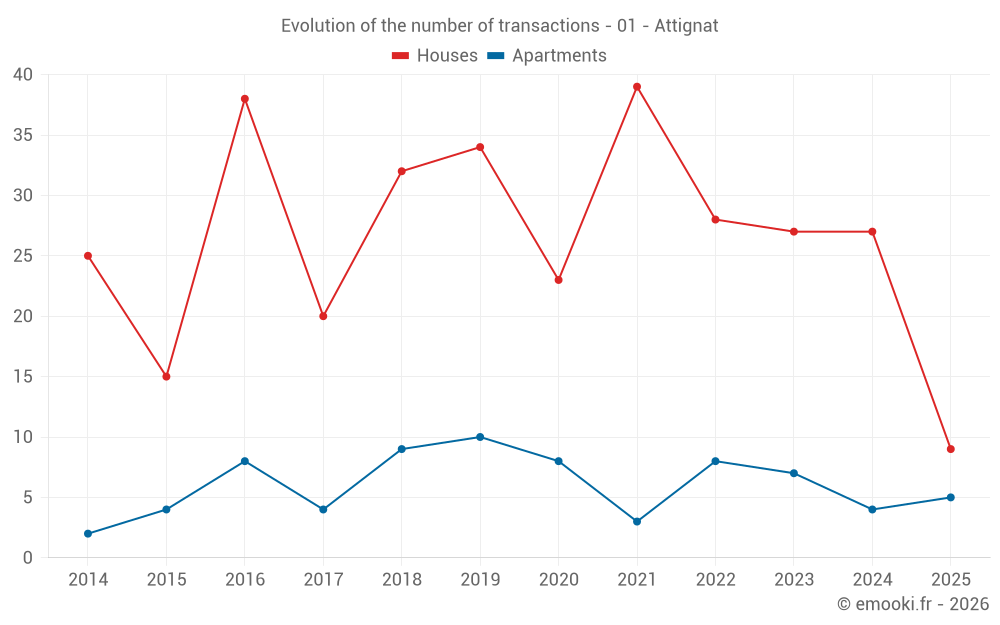
Median price on the 21 transactions of the last 12 months.
from 1 452 to
2 619 € /m²
60% of transactions from the 2nd to the 8th deciles.
ApartmentsApartments
2 095 € /m²
1-23-45-67-89-10
Reliability 7/10
Median price on the 14 transactions of the last 24 months.
from 1 261 to
2 640 € /m²
60% of transactions from the 2nd to the 8th deciles.
DwellingsDwellings
1 923 € /m²
1-23-45-67-89-10
Reliability 8/10
Median price on the 29 transactions of the last 12 months.
from 1 445 to
2 564 € /m²
60% of transactions from the 2nd to the 8th deciles.
HousesEvolution of the price per m² of houses
1 year
-19.7%
2 years
-8.9%
3 years
-21.1%
4 years
-13.5%
5 years
+0.6%
6 years
+2.9%
7 years
+0.5%
8 years
+7.8%
9 years
+12.9%
10 years
+12%
11 years
+10.1%
ApartmentsEvolution of the price per m² of apartments
1 year
--
2 years
-23.2%
3 years
+16.9%
4 years
--
5 years
+0.2%
6 years
+27.7%
7 years
+34.7%
8 years
--
9 years
+0.5%
10 years
--
11 years
--

Yearly evolution

Median price per m²

Number of transactions

Warning, last year incomplete. Projections made based on the proportions between semesters of the previous year at the departmental/national level and by type of property.

Yearly data

Descending order
Year
Houses
house
Price per m²
Houses
house
transactions
Apartments
apt.
Price per m²
Apartments
apt.
transactions
2025
1 923 €
9
1 829 €
5
2024
2 394 €
27
1 459 €
4
2023
2 112 €
27
2 380 €
7
2022
2 438 €
28
1 564 €
8
2021
2 222 €
39
1 899 €
3
2020
1 911 €
23
1 825 €
8
2019
1 868 €
34
1 432 €
10
2018
1 914 €
32
1 358 €
9
2017
1 784 €
20
1 434 €
4
2016
1 704 €
38
1 820 €
8
2015
1 717 €
15
1 367 €
4
2014
1 747 €
25
2 135 €
2

Quarterly evolution

Median price per m²

Number of transactions

Analysis

Structure of prices per m²

Values of price percentiles per m² over the periods used for the estimated price of each type of property.

Ain (01)

Most expensive cities

City
name
Descending orderHouses
house
Price per m²
6 836 €
5 676 €
5 576 €
5 534 €
5 509 €
5 298 €
5 248 €
5 234 €
5 159 €
5 146 €
City
name
Descending orderApartments
apt.
Price per m²
6 178 €
5 372 €
5 332 €
5 062 €
5 000 €
4 942 €
4 889 €
4 836 €
4 787 €
4 691 €

Least expensive cities

City
name
Ascending orderHouses
house
Price per m²
797 €
808 €
816 €
893 €
894 €
927 €
958 €
1 034 €
1 038 €
1 046 €
City
name
Ascending orderApartments
apt.
Price per m²
157 €
174 €
185 €
217 €
336 €
349 €
380 €
421 €
444 €