emooki
HomePrice mapTransactions
🇬🇧 English🇫🇷 Français🇩🇪 Deutsch🇪🇸 Español🇮🇹 Italiano

Real estate price map


Real estate price map in the municipality of L'Étang-Salé.

La Réunion (974)
L'Étang-Salé

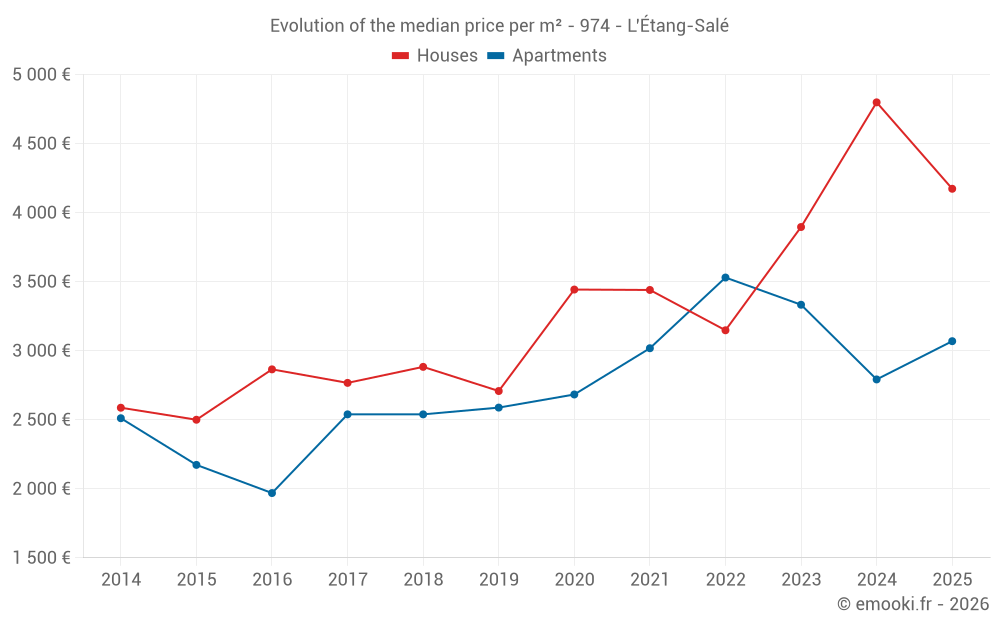
Median price of real estate
in the municipality of L'Étang-Salé

HousesHouses
4 173  /m²
1-23-45-67-89-10
Reliability 9/10
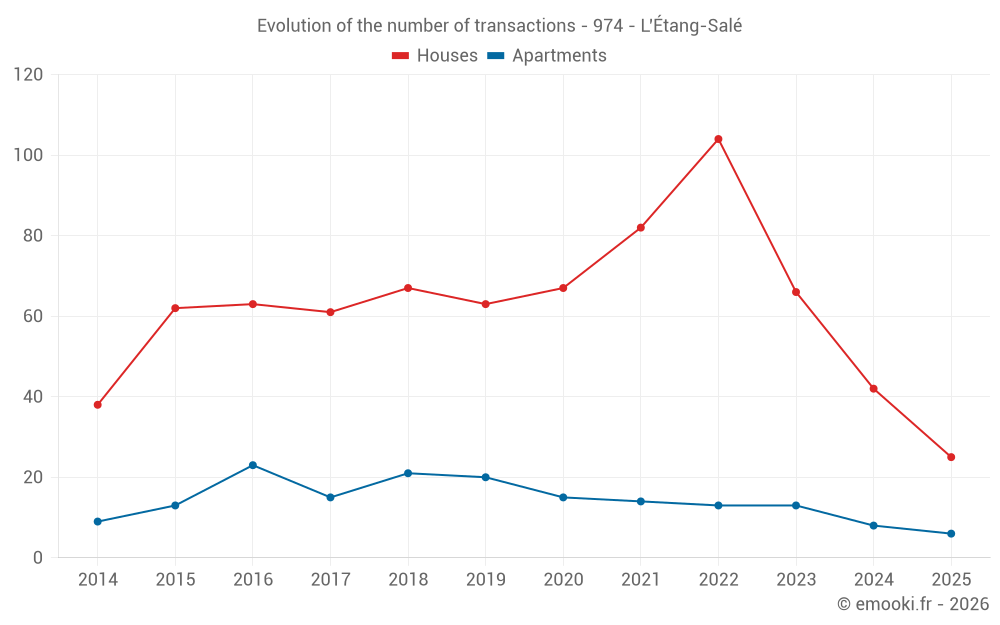
Median price on the 25 transactions of the last 6 months.
from 3 140 to
5 029  /m²
60% of transactions from the 2nd to the 8th deciles.
ApartmentsApartments
3 133  /m²
1-23-45-67-89-10
Reliability 7/10
Median price on the 21 transactions of the last 24 months.
from 2 209 to
3 984  /m²
60% of transactions from the 2nd to the 8th deciles.
DwellingsDwellings
3 984  /m²
1-23-45-67-89-10
Reliability 9/10
Median price on the 31 transactions of the last 6 months.
from 2 700 to
4 765  /m²
60% of transactions from the 2nd to the 8th deciles.
HousesEvolution of the price per m² of houses since...
1 year
-13%
2 years
+7.1%
3 years
+33%
4 years
+21%
5 years
+21%
6 years
+54%
7 years
+45%
8 years
+51%
9 years
+46%
10 years
+67%
11 years
+61%
ApartmentsEvolution of the price per m² of apartments since...
1 year
+10%
2 years
-7.9%
3 years
-13%
4 years
+1.7%
5 years
+14%
6 years
+19%
7 years
+21%
8 years
+21%
9 years
+56%
10 years
+41%
11 years
+22%

Yearly evolution

Evolution of the median price per m²

Evolution of the number of transactions

Warning, last year incomplete. Projections made based on the proportions between semesters of the previous year at the departmental/national level and by type of property.

Yearly data

Descending order
Year
Houses
house
transactions
Houses
house
Price per m²
Apartments
apt.
transactions
Apartments
apt.
Price per m²
2025
25
4 173 
6
3 069 
2024
42
4 799 
8
2 792 
2023
66
3 896 
13
3 333 
2022
104
3 148 
13
3 530 
2021
82
3 440 
14
3 018 
2020
67
3 443 
15
2 683 
2019
63
2 708 
20
2 588 
2018
67
2 883 
21
2 539 
2017
61
2 767 
15
2 539 
2016
63
2 865 
23
1 969 
2015
62
2 500 
13
2 173 
2014
38
2 587 
9
2 511 

Analysis

Structure of prices per m²

Values of price percentiles per m² over the periods used for the estimated price of each type of property.

Structure of transaction amounts

Values of transaction amounts percentiles over the periods used for the estimated price of each type of property.

Transaction amounts and prices per m² by percentile

Ascending order
Percentile
Houses
house
Price per m²
Houses
house
Transaction amount
Apartments
apt.
Price per m²
Apartments
apt.
Transaction amount
10th percentile
2 027 
109 K
1 943 
170 K
20th percentile
3 140 
229 K
2 209 
200 K
30th percentile
3 681 
279 K
2 290 
220 K
40th percentile
3 908 
387 K
2 833 
247 K
50th percentile
4 173 
403 K
3 133 
270 K
60th percentile
4 340 
460 K
3 167 
283 K
70th percentile
4 626 
536 K
3 580 
330 K
80th percentile
5 029 
549 K
3 984 
375 K
90th percentile
7 141 
577 K
4 179 
397 K

National and departmental comparison

Evolution of the median price per m² of houses

Evolution of the median price per m² of apartments

Quarterly evolution

Evolution of the median price per m²

Evolution of the number of transactions

Quarterly data

Descending order
Quarter
Houses
house
transactions
Houses
house
Price per m²
Apartments
apt.
transactions
Apartments
apt.
Price per m²
2025 Q2
11
4 173 
1
3 167 
2025 Q1
14
4 162 
5
2 971 
2024 Q4
12
4 226 
2
1 952 
2024 Q3
14
5 218 
4
2 792 
2024 Q2
7
2 796 
0
--- 
2024 Q1
9
4 776 
2
3 596 
2023 Q4
16
3 354 
1
3 580 
2023 Q3
18
4 838 
6
3 458 
2023 Q2
11
4 831 
2
4 108 
2023 Q1
21
3 858 
4
2 752 
2022 Q4
29
3 707 
1
1 521 
2022 Q3
23
2 545 
6
3 319 
2022 Q2
29
3 333 
4
4 188 
2022 Q1
23
2 364 
2
3 250 
2021 Q4
24
3 268 
5
4 004 
2021 Q3
25
3 426 
4
2 804 
2021 Q2
17
3 618 
4
2 880 
2021 Q1
16
3 404 
1
3 337 
2020 Q4
17
3 443 
7
2 842 
2020 Q3
17
3 300 
3
1 810 
2020 Q2
18
2 850 
3
3 636 
2020 Q1
15
3 533 
2
3 099 
2019 Q4
10
3 622 
4
3 118 
2019 Q3
18
2 170 
6
2 660 
2019 Q2
19
2 476 
5
2 383 
2019 Q1
16
2 888 
5
2 607 
2018 Q4
18
2 880 
4
2 832 
2018 Q3
24
3 118 
4
2 518 
2018 Q2
14
2 606 
7
2 500 
2018 Q1
11
2 871 
6
2 720 
2017 Q4
17
1 992 
4
2 500 
2017 Q3
16
3 118 
3
2 539 
2017 Q2
18
2 874 
5
2 790 
2017 Q1
10
3 124 
3
2 482 
2016 Q4
14
3 242 
7
2 500 
2016 Q3
23
2 917 
8
1 813 
2016 Q2
12
2 794 
6
1 697 
2016 Q1
14
2 644 
2
2 140 
2015 Q4
21
2 542 
5
3 084 
2015 Q3
12
2 500 
2
1 942 
2015 Q2
16
2 205 
3
3 333 
2015 Q1
13
2 500 
3
2 077 
2014 Q4
6
2 729 
4
2 484 
2014 Q3
12
2 676 
1
2 102 
2014 Q2
9
3 063 
2
2 559 
2014 Q1
11
2 252 
2
2 812 

La Réunion (974)

Most expensive cities

City
name
Descending orderHouses
house
Price per m²
4 316 
4 173 
3 925 
3 571 
3 342 
3 308 
3 184 
3 115 
3 033 
City
name
Descending orderApartments
apt.
Price per m²
5 559 
4 892 
3 696 
3 155 
3 133 
2 908 
2 636 
2 537 
2 536 
2 474 

Least expensive cities

City
name
Ascending orderHouses
house
Price per m²
1 320 
1 478 
1 606 
1 908 
1 996 
2 006 
2 018 
2 109 
2 235 
City
name
Ascending orderApartments
apt.
Price per m²
1 098 
1 246 
1 409 
1 437 
1 519 
1 667 
1 776 
1 965 
2 098 
2 111