emooki
HomePrice mapTransactions
🇬🇧 English🇫🇷 Français🇩🇪 Deutsch🇪🇸 Español🇮🇹 Italiano

Real estate price map


Real estate price map in the municipality of Schœlcher.

Martinique (972)
Schœlcher

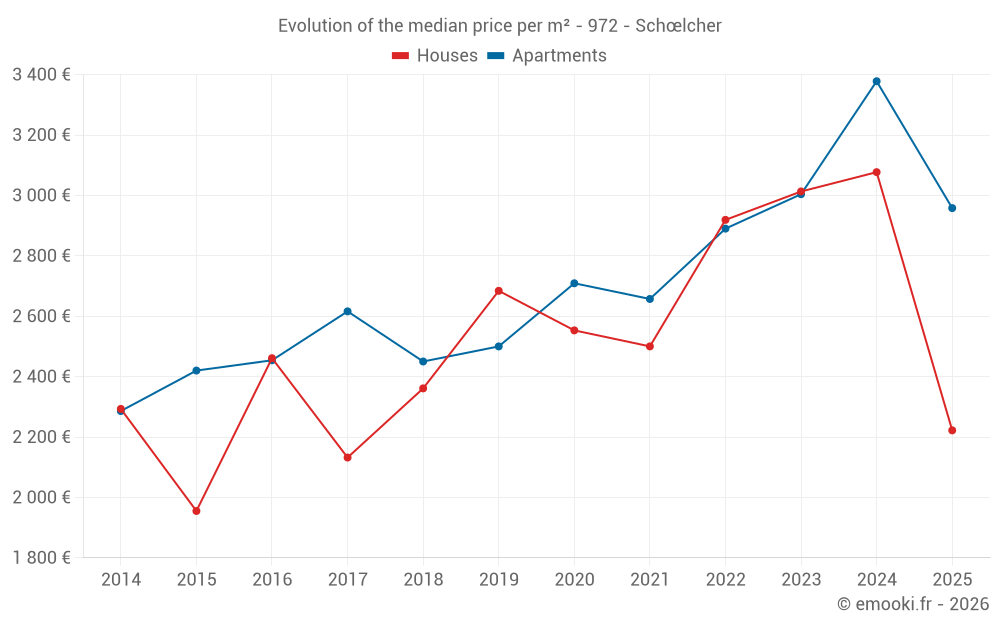
Median price of real estate
in the municipality of Schœlcher

HousesHouses
2 540  /m²
1-23-45-67-89-10
Reliability 8/10
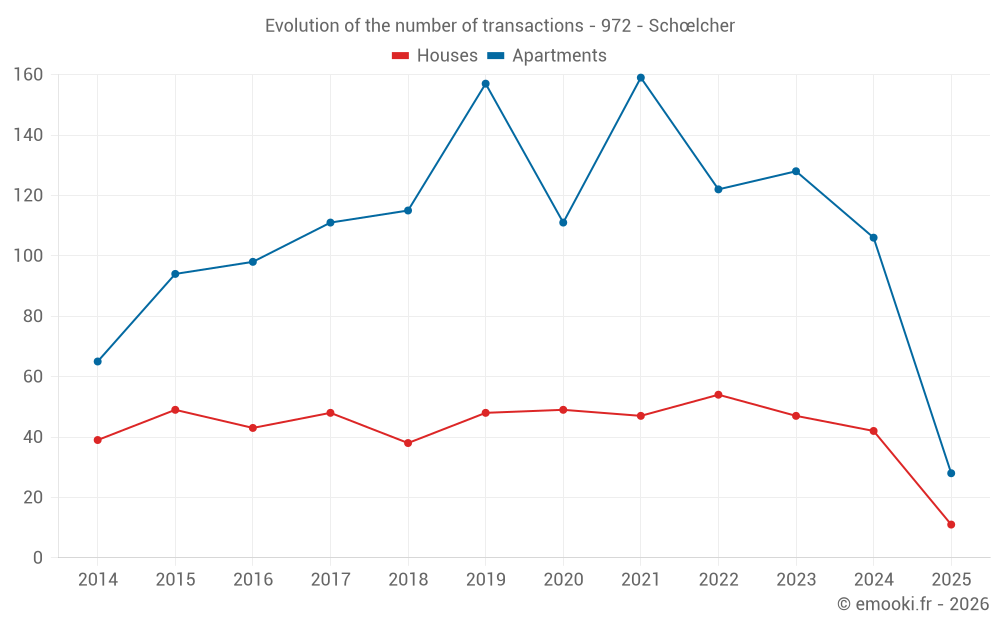
Median price on the 33 transactions of the last 12 months.
from 1 481 to
3 876  /m²
60% of transactions from the 2nd to the 8th deciles.
ApartmentsApartments
2 958  /m²
1-23-45-67-89-10
Reliability 9/10
Median price on the 28 transactions of the last 6 months.
from 2 015 to
3 835  /m²
60% of transactions from the 2nd to the 8th deciles.
DwellingsDwellings
2 852  /m²
1-23-45-67-89-10
Reliability 9/10
Median price on the 39 transactions of the last 6 months.
from 1 572 to
3 885  /m²
60% of transactions from the 2nd to the 8th deciles.
HousesEvolution of the price per m² of houses since...
1 year
-28%
2 years
-26%
3 years
-24%
4 years
-11%
5 years
-13%
6 years
-17%
7 years
-5.9%
8 years
+4.2%
9 years
-10%
10 years
+14%
11 years
-3.1%
ApartmentsEvolution of the price per m² of apartments since...
1 year
-12%
2 years
-1.5%
3 years
+2.4%
4 years
+11%
5 years
+9.2%
6 years
+18%
7 years
+21%
8 years
+13%
9 years
+21%
10 years
+22%
11 years
+29%

Yearly evolution

Evolution of the median price per m²

Evolution of the number of transactions

Warning, last year incomplete. Projections made based on the proportions between semesters of the previous year at the departmental/national level and by type of property.

Yearly data

Descending order
Year
Houses
house
transactions
Houses
house
Price per m²
Apartments
apt.
transactions
Apartments
apt.
Price per m²
2025
11
2 222 
28
2 958 
2024
42
3 077 
106
3 378 
2023
47
3 013 
128
3 004 
2022
54
2 919 
122
2 890 
2021
47
2 500 
159
2 657 
2020
49
2 553 
111
2 709 
2019
48
2 684 
157
2 500 
2018
38
2 361 
115
2 450 
2017
48
2 132 
111
2 616 
2016
43
2 461 
98
2 454 
2015
49
1 955 
94
2 420 
2014
39
2 293 
65
2 286 

Analysis

Structure of prices per m²

Values of price percentiles per m² over the periods used for the estimated price of each type of property.

Structure of transaction amounts

Values of transaction amounts percentiles over the periods used for the estimated price of each type of property.

Transaction amounts and prices per m² by percentile

Ascending order
Percentile
Houses
house
Price per m²
Houses
house
Transaction amount
Apartments
apt.
Price per m²
Apartments
apt.
Transaction amount
10th percentile
959 
63 000 
1 305 
76 800 
20th percentile
1 481 
124 K
2 015 
81 169 
30th percentile
2 080 
171 K
2 577 
100 K
40th percentile
2 236 
201 K
2 825 
109 K
50th percentile
2 540 
245 K
2 958 
167 K
60th percentile
3 074 
266 K
3 167 
192 K
70th percentile
3 685 
362 K
3 483 
250 K
80th percentile
3 876 
402 K
3 835 
310 K
90th percentile
4 342 
454 K
4 505 
367 K

National and departmental comparison

Evolution of the median price per m² of houses

Evolution of the median price per m² of apartments

Quarterly evolution

Evolution of the median price per m²

Evolution of the number of transactions

Quarterly data

Descending order
Quarter
Houses
house
transactions
Houses
house
Price per m²
Apartments
apt.
transactions
Apartments
apt.
Price per m²
2025 Q2
2
2 753 
4
3 064 
2025 Q1
9
2 222 
24
2 958 
2024 Q4
14
2 758 
28
3 460 
2024 Q3
8
3 109 
26
3 250 
2024 Q2
12
3 558 
29
3 375 
2024 Q1
8
2 601 
23
3 524 
2023 Q4
13
2 824 
23
3 333 
2023 Q3
11
3 421 
24
2 988 
2023 Q2
13
3 504 
36
2 784 
2023 Q1
10
3 228 
45
2 929 
2022 Q4
13
3 091 
36
2 877 
2022 Q3
23
3 099 
36
2 970 
2022 Q2
9
2 694 
29
2 333 
2022 Q1
9
2 511 
21
2 962 
2021 Q4
11
2 442 
44
2 738 
2021 Q3
9
3 377 
43
2 604 
2021 Q2
12
2 066 
41
2 612 
2021 Q1
15
2 391 
31
2 681 
2020 Q4
16
2 522 
37
2 902 
2020 Q3
16
2 726 
35
2 957 
2020 Q2
8
2 852 
20
2 450 
2020 Q1
9
2 462 
19
2 667 
2019 Q4
13
3 258 
53
2 400 
2019 Q3
18
1 946 
30
2 755 
2019 Q2
11
2 418 
33
2 430 
2019 Q1
6
3 004 
41
2 467 
2018 Q4
13
2 303 
34
2 722 
2018 Q3
9
2 657 
31
2 314 
2018 Q2
8
2 010 
28
2 366 
2018 Q1
8
2 480 
22
2 367 
2017 Q4
16
2 264 
36
2 614 
2017 Q3
10
2 278 
23
2 737 
2017 Q2
10
1 783 
29
2 565 
2017 Q1
12
2 330 
23
2 544 
2016 Q4
7
2 410 
26
2 382 
2016 Q3
12
2 558 
33
2 425 
2016 Q2
15
2 222 
19
2 368 
2016 Q1
9
2 632 
20
2 757 
2015 Q4
14
2 363 
33
2 688 
2015 Q3
15
1 951 
27
2 222 
2015 Q2
10
1 810 
21
2 386 
2015 Q1
10
1 555 
13
2 657 
2014 Q4
13
1 842 
9
1 923 
2014 Q3
8
2 650 
18
2 504 
2014 Q2
7
3 213 
22
2 260 
2014 Q1
11
1 842 
16
1 896 

Martinique (972)

Most expensive cities

City
name
Descending orderHouses
house
Price per m²
4 199 
4 076 
3 500 
3 198 
3 143 
3 130 
2 979 
2 913 
2 864 
City
name
Descending orderApartments
apt.
Price per m²
6 098 
4 432 
4 200 
3 951 
3 432 
3 370 
2 958 
2 945 
2 866 

Least expensive cities

City
name
Ascending orderHouses
house
Price per m²
522 
714 
935 
1 184 
1 332 
1 442 
1 491 
City
name
Ascending orderApartments
apt.
Price per m²
19 
756 
1 037 
1 088 
1 233