emooki
HomePrice mapTransactions
🇬🇧 English🇫🇷 Français🇩🇪 Deutsch🇪🇸 Español🇮🇹 Italiano

Real estate price map


Real estate price map in the municipality of Rivière-Salée.

Martinique (972)
Rivière-Salée

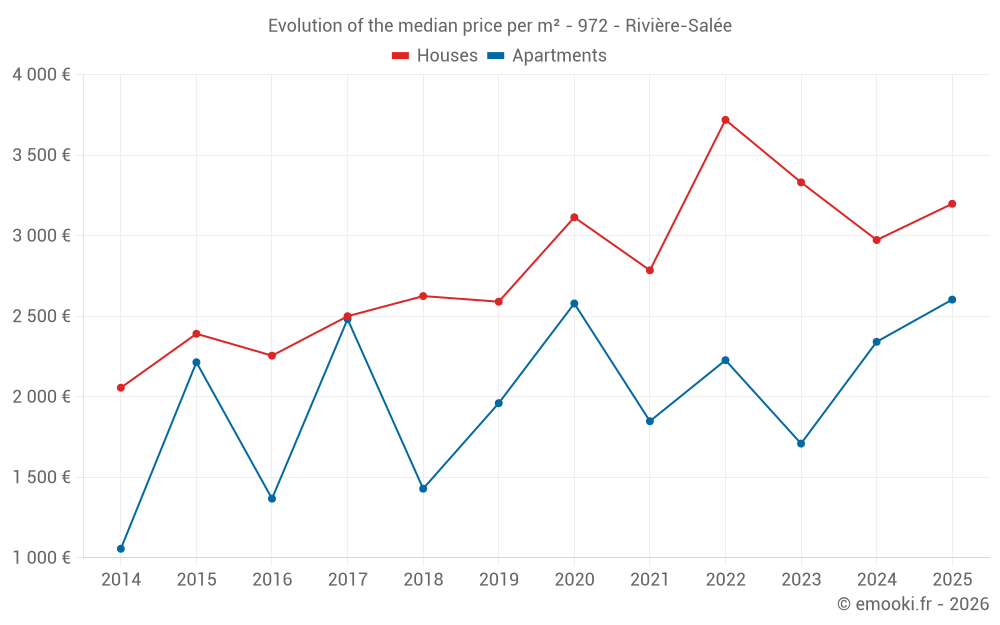
Median price of real estate
in the municipality of Rivière-Salée

HousesHouses
3 198  /m²
1-23-45-67-89-10
Reliability 9/10
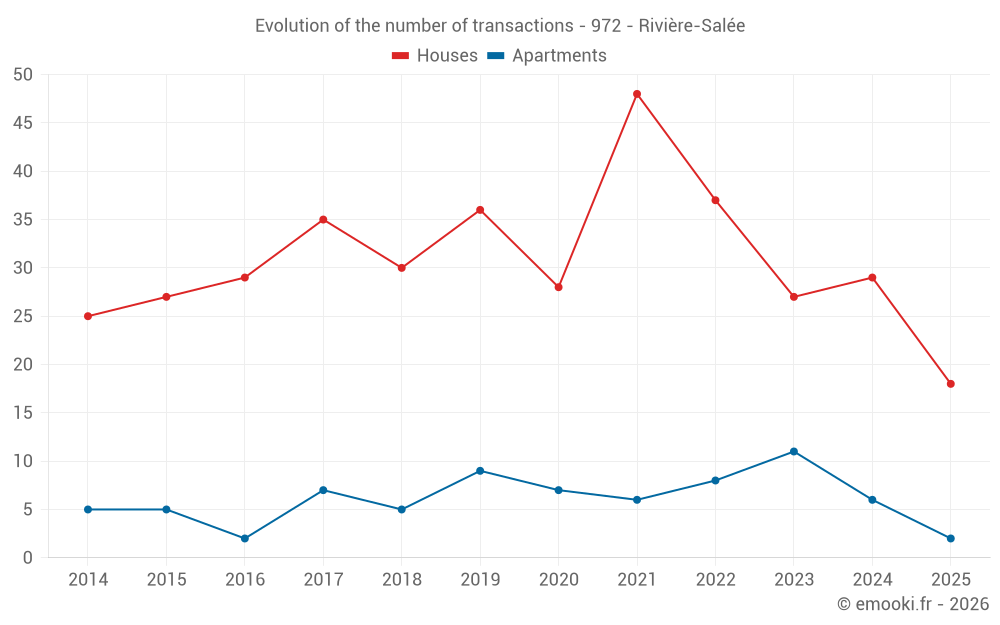
Median price on the 18 transactions of the last 6 months.
from 1 037 to
4 159  /m²
60% of transactions from the 2nd to the 8th deciles.
ApartmentsApartments
2 045  /m²
1-23-45-67-89-10
Reliability 6/10
Median price on the 22 transactions of the last 36 months.
from 1 317 to
3 432  /m²
60% of transactions from the 2nd to the 8th deciles.
DwellingsDwellings
3 198  /m²
1-23-45-67-89-10
Reliability 9/10
Median price on the 20 transactions of the last 6 months.
from 897 to
4 190  /m²
60% of transactions from the 2nd to the 8th deciles.
HousesEvolution of the price per m² of houses since...
1 year
+7.6%
2 years
-4%
3 years
-14%
4 years
+15%
5 years
+2.7%
6 years
+23%
7 years
+22%
8 years
+28%
9 years
+42%
10 years
+34%
11 years
+56%
ApartmentsEvolution of the price per m² of apartments since...
1 year
--
2 years
--
3 years
--
4 years
--
5 years
--
6 years
--
7 years
--
8 years
--
9 years
--
10 years
--
11 years
--

Yearly evolution

Evolution of the median price per m²

Evolution of the number of transactions

Warning, last year incomplete. Projections made based on the proportions between semesters of the previous year at the departmental/national level and by type of property.

Yearly data

Descending order
Year
Houses
house
transactions
Houses
house
Price per m²
Apartments
apt.
transactions
Apartments
apt.
Price per m²
2025
18
3 198 
2
2 603 
2024
29
2 973 
6
2 341 
2023
27
3 331 
11
1 709 
2022
37
3 719 
8
2 227 
2021
48
2 785 
6
1 848 
2020
28
3 114 
7
2 579 
2019
36
2 590 
9
1 960 
2018
30
2 625 
5
1 429 
2017
35
2 500 
7
2 482 
2016
29
2 255 
2
1 367 
2015
27
2 391 
5
2 214 
2014
25
2 056 
5
1 056 

Analysis

Structure of prices per m²

Values of price percentiles per m² over the periods used for the estimated price of each type of property.

Structure of transaction amounts

Values of transaction amounts percentiles over the periods used for the estimated price of each type of property.

Transaction amounts and prices per m² by percentile

Ascending order
Percentile
Houses
house
Price per m²
Houses
house
Transaction amount
Apartments
apt.
Price per m²
Apartments
apt.
Transaction amount
10th percentile
489 
61 530 
968 
59 700 
20th percentile
1 037 
96 600 
1 317 
105 K
30th percentile
2 036 
241 K
1 630 
131 K
40th percentile
3 011 
252 K
1 718 
139 K
50th percentile
3 198 
285 K
2 045 
150 K
60th percentile
3 257 
338 K
2 349 
192 K
70th percentile
3 939 
379 K
2 588 
217 K
80th percentile
4 159 
406 K
3 432 
278 K
90th percentile
5 308 
434 K
4 191 
344 K

National and departmental comparison

Evolution of the median price per m² of houses

Evolution of the median price per m² of apartments

Quarterly evolution

Evolution of the median price per m²

Evolution of the number of transactions

Quarterly data

Descending order
Quarter
Houses
house
transactions
Houses
house
Price per m²
Apartments
apt.
transactions
Apartments
apt.
Price per m²
2025 Q2
3
1 632 
0
--- 
2025 Q1
15
3 224 
2
2 603 
2024 Q4
10
3 764 
1
5 333 
2024 Q3
6
3 034 
0
--- 
2024 Q2
8
2 436 
2
2 293 
2024 Q1
5
2 973 
3
2 302 
2023 Q4
10
3 476 
2
1 484 
2023 Q3
9
1 500 
3
1 026 
2023 Q2
5
4 048 
3
1 884 
2023 Q1
3
2 474 
3
2 381 
2022 Q4
8
3 710 
2
2 238 
2022 Q3
16
3 896 
1
3 704 
2022 Q2
6
4 588 
3
2 778 
2022 Q1
7
3 218 
2
1 652 
2021 Q4
19
2 903 
2
2 436 
2021 Q3
13
3 068 
1
1 902 
2021 Q2
11
2 619 
0
--- 
2021 Q1
5
2 184 
3
1 728 
2020 Q4
8
3 232 
4
2 075 
2020 Q3
7
2 838 
0
--- 
2020 Q2
9
3 225 
2
3 178 
2020 Q1
4
2 534 
1
1 206 
2019 Q4
13
2 329 
3
2 130 
2019 Q3
7
3 431 
4
1 346 
2019 Q2
9
2 722 
2
1 768 
2019 Q1
7
2 743 
0
--- 
2018 Q4
10
2 778 
0
--- 
2018 Q3
9
2 917 
3
1 103 
2018 Q2
10
1 977 
1
4 027 
2018 Q1
1
2 705 
1
1 429 
2017 Q4
10
1 664 
2
2 958 
2017 Q3
9
2 288 
2
2 194 
2017 Q2
12
3 123 
0
--- 
2017 Q1
4
2 021 
3
1 444 
2016 Q4
3
579 
2
1 367 
2016 Q3
10
2 616 
0
--- 
2016 Q2
9
2 231 
0
--- 
2016 Q1
7
3 378 
0
--- 
2015 Q4
6
2 219 
0
--- 
2015 Q3
7
2 121 
0
--- 
2015 Q2
8
2 496 
3
2 734 
2015 Q1
6
2 603 
2
1 646 
2014 Q4
5
1 545 
2
926 
2014 Q3
7
2 400 
0
--- 
2014 Q2
3
287 
0
--- 
2014 Q1
10
2 389 
3
1 056 

Martinique (972)

Most expensive cities

City
name
Descending orderHouses
house
Price per m²
4 199 
4 076 
3 500 
3 198 
3 143 
3 130 
2 979 
2 913 
2 864 
City
name
Descending orderApartments
apt.
Price per m²
6 098 
4 432 
4 200 
3 951 
3 432 
3 370 
2 958 
2 945 
2 866 

Least expensive cities

City
name
Ascending orderHouses
house
Price per m²
522 
714 
935 
1 184 
1 332 
1 442 
1 491 
City
name
Ascending orderApartments
apt.
Price per m²
19 
756 
1 037 
1 088 
1 233