emooki
HomePrice mapTransactions
🇬🇧 English🇫🇷 Français🇩🇪 Deutsch🇪🇸 Español🇮🇹 Italiano

Real estate price map


Real estate price map in the municipality of Le Moule, choose a section to see transactions by parcel.

Guadeloupe (971)
Le Moule

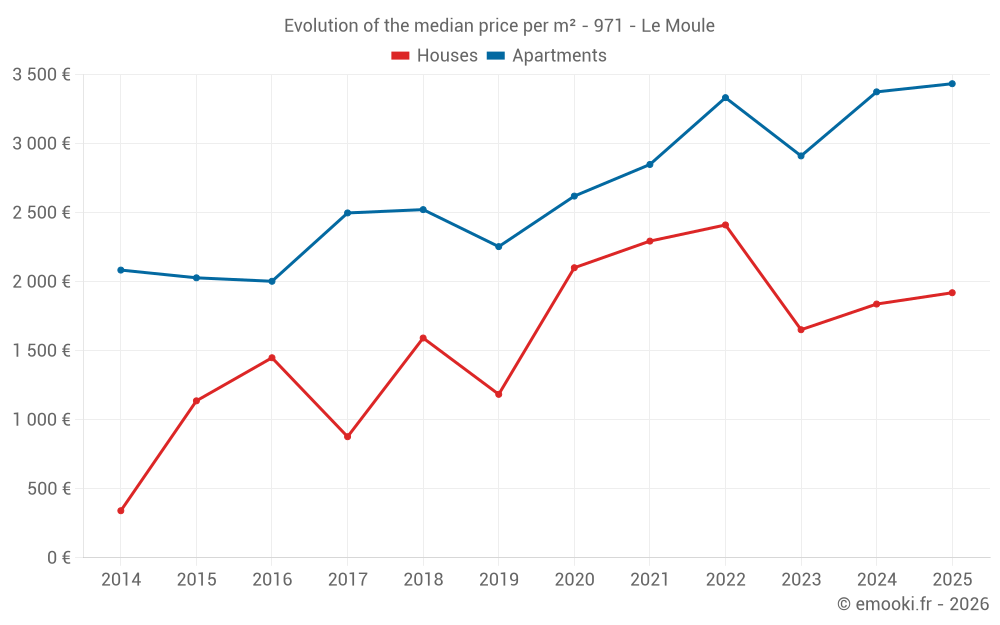
Median price of real estate
in the municipality of Le Moule

HousesHouses
2 667 € /m²
1-23-45-67-89-10
Reliability 8/10
Median price on the 43 transactions of the last 12 months.
from 360 to
4 168 € /m²
60% of transactions from the 2nd to the 8th deciles.
ApartmentsApartments
3 034 € /m²
1-23-45-67-89-10
Reliability 7/10
Median price on the 46 transactions of the last 24 months.
from 2 061 to
3 889 € /m²
60% of transactions from the 2nd to the 8th deciles.
DwellingsDwellings
2 782 € /m²
1-23-45-67-89-10
Reliability 8/10
Median price on the 58 transactions of the last 12 months.
from 845 to
4 083 € /m²
60% of transactions from the 2nd to the 8th deciles.
HousesEvolution of the price per m² of houses since...
1 year
+4.5%
2 years
+16%
3 years
-20%
4 years
-16%
5 years
-8.6%
6 years
+62%
7 years
+21%
8 years
+119%
9 years
+33%
10 years
+69%
11 years
+463%
The price per m² of houses has decreased by 20% since 3 years, but it has increased by 463% in 11 years.

Yearly evolution

Evolution of the median price per m²

Evolution of the median price per m² - 971 - Le Moule

Evolution of the number of transactions

Warning, last year incomplete. Projections made based on the proportions between semesters of the previous year at the departmental/national level and by type of property.

Yearly data

Descending order
Year
Houses
house
transactions
Houses
house
Price per m²
Apartments
apt.
transactions
Apartments
apt.
Price per m²
2025
10
1 920 €
2
3 434 €
2024
62
1 838 €
23
3 375 €
2023
70
1 652 €
27
2 911 €
2022
75
2 411 €
28
3 333 €
2021
57
2 294 €
24
2 849 €
2020
55
2 101 €
32
2 620 €
2019
61
1 184 €
23
2 254 €
2018
74
1 592 €
26
2 522 €
2017
77
877 €
26
2 498 €
2016
42
1 449 €
22
2 003 €
2015
56
1 137 €
24
2 028 €
2014
61
341 €
20
2 084 €

Analysis

Structure of prices per m²

Values of price percentiles per m² over the periods used for the estimated price of each type of property.

Structure of transaction amounts

Values of transaction amounts percentiles over the periods used for the estimated price of each type of property.

Transaction amounts and prices per m² by percentile

Ascending order
Percentile
Houses
house
Price per m²
Houses
house
Transaction amount
Apartments
apt.
Price per m²
Apartments
apt.
Transaction amount
10th percentile
61 €
3 377 €
1 056 €
67 000 €
20th percentile
360 €
21 520 €
2 061 €
86 000 €
30th percentile
1 165 €
73 000 €
2 550 €
102 K€
40th percentile
1 614 €
89 514 €
2 750 €
120 K€
50th percentile
2 667 €
147 K€
3 034 €
131 K€
60th percentile
2 836 €
199 K€
3 333 €
150 K€
70th percentile
3 396 €
251 K€
3 454 €
159 K€
80th percentile
4 168 €
364 K€
3 889 €
172 K€
90th percentile
4 617 €
569 K€
4 326 €
224 K€

National and departmental comparison

Evolution of the median price per m² of houses

Evolution of the median price per m² of apartments

Quarterly evolution

Evolution of the median price per m²

Evolution of the number of transactions

Quarterly data

Descending order
Quarter
Houses
house
transactions
Houses
house
Price per m²
Apartments
apt.
transactions
Apartments
apt.
Price per m²
2025 Q2
1
1 660 €
0
--- €
2025 Q1
9
2 179 €
2
3 434 €
2024 Q4
18
2 132 €
6
3 370 €
2024 Q3
15
2 805 €
7
3 375 €
2024 Q2
15
2 131 €
6
3 444 €
2024 Q1
14
370 €
4
3 077 €
2023 Q4
12
1 815 €
8
2 686 €
2023 Q3
20
1 850 €
13
2 911 €
2023 Q2
18
1 842 €
3
3 667 €
2023 Q1
20
480 €
3
4 242 €
2022 Q4
18
2 388 €
11
3 534 €
2022 Q3
17
2 347 €
6
3 008 €
2022 Q2
22
2 770 €
5
3 331 €
2022 Q1
18
2 234 €
6
3 112 €
2021 Q4
10
2 661 €
8
2 829 €
2021 Q3
16
1 946 €
8
2 320 €
2021 Q2
14
2 232 €
5
2 961 €
2021 Q1
17
2 778 €
3
3 642 €
2020 Q4
22
2 144 €
5
2 661 €
2020 Q3
13
2 101 €
13
2 613 €
2020 Q2
6
2 570 €
5
2 627 €
2020 Q1
14
1 273 €
9
2 522 €
2019 Q4
14
318 €
6
2 060 €
2019 Q3
23
1 404 €
5
3 071 €
2019 Q2
12
1 297 €
8
2 138 €
2019 Q1
12
1 938 €
4
2 298 €
2018 Q4
24
1 438 €
8
2 244 €
2018 Q3
21
1 715 €
8
2 586 €
2018 Q2
16
1 682 €
4
3 110 €
2018 Q1
13
1 747 €
6
2 426 €
2017 Q4
31
1 038 €
9
4 219 €
2017 Q3
7
1 500 €
6
2 498 €
2017 Q2
28
102 €
9
2 165 €
2017 Q1
11
2 179 €
2
2 543 €
2016 Q4
14
1 386 €
3
1 032 €
2016 Q3
13
1 207 €
10
596 €
2016 Q2
8
2 208 €
4
2 516 €
2016 Q1
7
1 160 €
5
2 437 €
2015 Q4
21
205 €
5
1 983 €
2015 Q3
14
1 673 €
5
2 407 €
2015 Q2
12
719 €
7
1 909 €
2015 Q1
9
337 €
7
2 045 €
2014 Q4
19
1 094 €
7
1 248 €
2014 Q3
23
246 €
2
2 190 €
2014 Q2
5
1 537 €
7
2 493 €
2014 Q1
14
112 €
4
2 460 €

Overview of the latest real estate transactions

The following list is an anonymized overview of the latest transactions. For more details and to find all transactions, please use the map to view transactions by plot or the transaction search page for a search by criteria.

2025-04-08
78 000 €
1 660 € /m²(47 m²)
Sale
Houses
House
3 rooms
47 m2
Land
165 m2
-Sols
2025-04-07
6 000 €
Sale
Land
40 m2
-Sols
2025-04-03
47 400 €
Sale
Land
237 m2
-Terrains à bâtir
2025-04-01
10 000 €
Sale
Land
1268 m2
-Terres
2025-03-31
148 000 €
Sale
Land
1031 m2
-Terrains à bâtir
2025-03-31
146 667 €
1 275 € /m²(115 m²)
Sale
Houses
House
2 rooms
115 m2
Land
1174 m2
-Terrains à bâtir
2025-03-31
335 000 €
4 188 € /m²(80 m²)
Sale
Houses
House
4 rooms
80 m2
Land
926 m2
-Terrains à bâtir
2025-03-31
1 675 €
Sale
Land
1674 m2
-Terres
2025-03-28
259 000 €
Sale
Land
1510 m2
-Terres
2025-03-24
100 000 €
Sale
Land
769 m2
-Terrains à bâtir
2025-03-20
305 893 €
Sale
Land
811 m2
-Sols
2025-03-19
41 970 €
341 € /m²(123 m²)
Sale
Commercial property
123 m2
Land
1000 m2
-Sols
Land
2399 m2
-Terres
2025-03-19
4 561 €
Sale
Land
136 m2
-Sols
2025-03-03
70 000 €
Sale
Land
56 m2
-Sols
Land
224 m2
-Sols
2025-02-27
60 000 €
Sale
Land
133 m2
-Sols
2025-02-26
100 000 €
Sale
Land
1380 m2
-Terrains à bâtir
2025-02-25
352 560 €
Sale
Land
862 m2
-Bois
Land
670 m2
-Bois
2025-02-25
42 268 €
742 € /m²(57 m²)
Sale
Houses
House
3 rooms
57 m2
Land
503 m2
-Sols
2025-02-18
100 000 €
Sale
Land
1000 m2
-Terres
2025-02-14
250 000 €
Sale
Land
2497 m2
-Prés
2031 transactions listed in the municipality

Guadeloupe (971)

Most expensive cities

City
name
Descending orderHouses
house
Price per m²
6 559 €
4 778 €
3 545 €
3 469 €
3 458 €
3 284 €
3 116 €
2 772 €
2 731 €
2 722 €
City
name
Descending orderApartments
apt.
Price per m²
5 484 €
4 995 €
4 390 €
3 899 €
3 560 €
3 335 €
3 129 €
3 058 €
3 034 €
2 802 €

Least expensive cities

City
name
Ascending orderHouses
house
Price per m²
51 €
389 €
591 €
726 €
867 €
896 €
1 016 €
1 158 €
1 316 €
1 328 €
City
name
Ascending orderApartments
apt.
Price per m²
30 €
58 €
738 €
862 €
1 100 €
1 167 €
1 170 €
1 197 €
1 310 €
1 421 €