Median price of real estate
in the municipality of Baie-Mahault
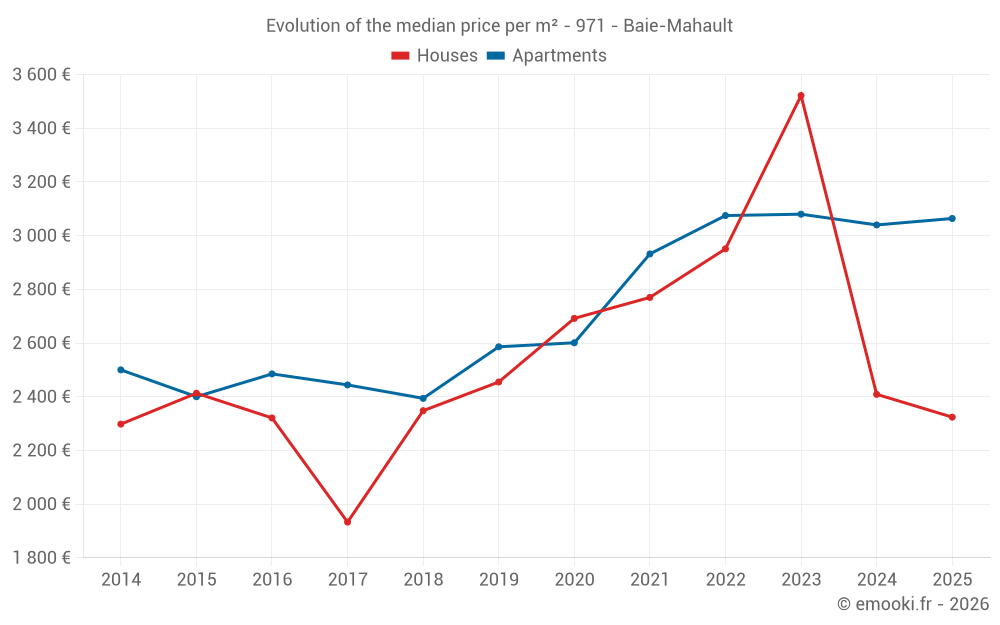
Houses
2 247 € /m²
Reliability 8/10
Median price on the 75 transactions of the last 12 months.
from 1 351 to
3 941 € /m²
3 941 € /m²
60% of transactions from the 2nd to the 8th deciles.
Apartments
3 058 € /m²
Reliability 8/10
Median price on the 39 transactions of the last 12 months.
from 2 410 to
3 462 € /m²
3 462 € /m²
60% of transactions from the 2nd to the 8th deciles.
Dwellings
2 696 € /m²
Reliability 9/10
Median price on the 30 transactions of the last 6 months.
from 1 478 to
3 729 € /m²
3 729 € /m²
60% of transactions from the 2nd to the 8th deciles.