Real estate price map
Real estate price map in the municipality of Saint-Sulpice-les-Feuilles, choose a section to see transactions by parcel.
Haute-Vienne (87)
Price per m² in Saint-Sulpice-les-Feuilles
Median price of real estate
in the municipality of Saint-Sulpice-les-Feuilles
Houses
936 € /m²
Reliability 7/10
Median price on the 27 transactions of the last 24 months.
from 595 to
1 574 € /m²
1 574 € /m²
60% of transactions from the 2nd to the 8th deciles.
Apartments
263 € /m²
Reliability 2/10
Median price on the 5 transactions of the last 96 months.
Dwellings
922 € /m²
Reliability 7/10
Median price on the 28 transactions of the last 24 months.
from 570 to
1 569 € /m²
1 569 € /m²
60% of transactions from the 2nd to the 8th deciles.
Evolution of the price per m² of houses since...
1 year
+44%
2 years
+46%
3 years
-5.8%
4 years
+60%
5 years
+43%
6 years
+80%
7 years
+99%
8 years
+21%
9 years
+19%
10 years
+17%
11 years
+16%
The price per m² of houses has decreased by 5.8% since 3 years, but it has increased by 99% in 7 years.
498 transactions listed in the municipality
Yearly data
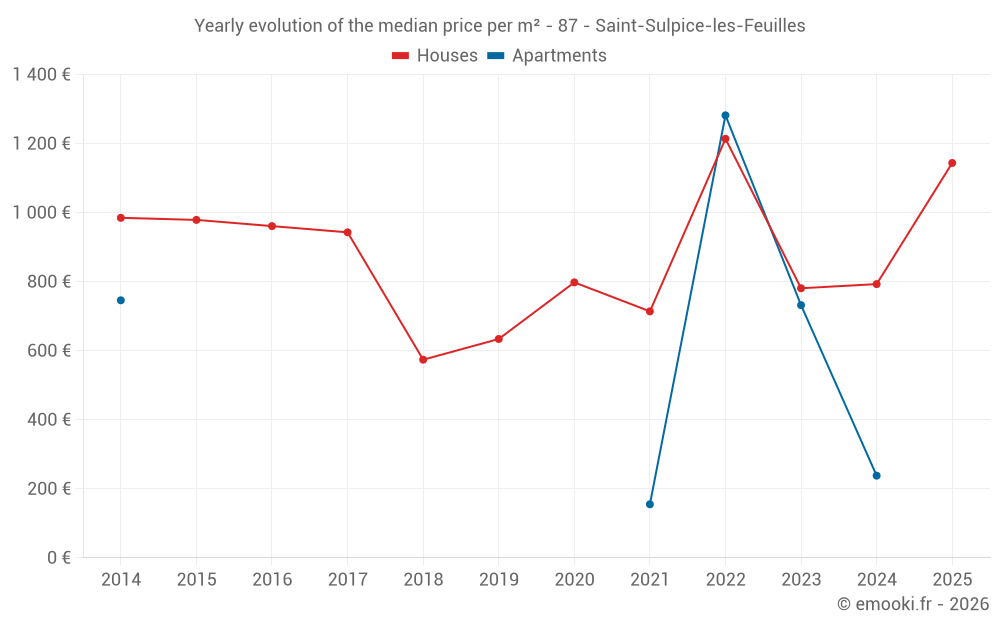
Yearly evolution of the median price per m²
Yearly evolution of the number of transactions

Yearly table
Year
house
transactions
transactions
house
Price per m²
Price per m²
apt.
transactions
transactions
apt.
Price per m²
Price per m²
2025
14
1 144 €
0
--- €
2024
13
793 €
1
238 €
2023
21
781 €
2
732 €
2022
34
1 214 €
1
1 282 €
2021
33
714 €
1
155 €
2020
24
798 €
0
--- €
2019
10
634 €
0
--- €
2018
16
574 €
0
--- €
2017
25
943 €
0
--- €
2016
10
961 €
0
--- €
2015
16
979 €
0
--- €
2014
15
985 €
1
746 €
Analysis
Structure of prices per m²
Values of price percentiles per m² over the periods used for the estimated price of each type of property.
Structure of transaction amounts
Values of transaction amounts percentiles over the periods used for the estimated price of each type of property.
Transaction amounts and prices per m² by percentile
Percentile
house
Price per m²
Price per m²
house
Transaction amount
Transaction amount
apt.
Price per m²
Price per m²
apt.
Transaction amount
Transaction amount
10th percentile
504 €
42 400 €
188 €
33 800 €
20th percentile
595 €
49 200 €
221 €
42 600 €
30th percentile
718 €
58 000 €
243 €
47 600 €
40th percentile
863 €
73 000 €
253 €
48 800 €
50th percentile
936 €
95 300 €
263 €
50 000 €
60th percentile
1 224 €
119 K€
638 €
72 040 €
70th percentile
1 472 €
131 K€
1 013 €
94 080 €
80th percentile
1 574 €
152 K€
1 216 €
108 K€
90th percentile
1 755 €
279 K€
1 249 €
114 K€
National and departmental comparison
Evolution of the median price per m² of houses
Evolution of the median price per m² of apartments
Quarterly data
Quarterly evolution of the median price per m²
Quarterly evolution of the number of transactions
Quarterly table
Quarter
house
transactions
transactions
house
Price per m²
Price per m²
apt.
transactions
transactions
apt.
Price per m²
Price per m²
2025 Q4
6
1 436 €
0
--- €
2025 Q3
2
1 418 €
0
--- €
2025 Q2
5
659 €
0
--- €
2025 Q1
1
936 €
0
--- €
2024 Q4
4
763 €
0
--- €
2024 Q3
1
2 439 €
1
238 €
2024 Q2
4
816 €
0
--- €
2024 Q1
4
1 040 €
0
--- €
2023 Q4
7
781 €
0
--- €
2023 Q3
5
672 €
1
263 €
2023 Q2
5
764 €
0
--- €
2023 Q1
4
1 088 €
1
1 200 €
2022 Q4
13
1 269 €
0
--- €
2022 Q3
8
912 €
0
--- €
2022 Q2
6
1 210 €
1
1 282 €
2022 Q1
7
1 250 €
0
--- €
2021 Q4
10
1 164 €
0
--- €
2021 Q3
13
575 €
1
155 €
2021 Q2
5
600 €
0
--- €
2021 Q1
5
1 091 €
0
--- €
2020 Q4
11
808 €
0
--- €
2020 Q3
4
470 €
0
--- €
2020 Q2
5
825 €
0
--- €
2020 Q1
4
876 €
0
--- €
2019 Q4
2
424 €
0
--- €
2019 Q3
5
438 €
0
--- €
2019 Q2
1
753 €
0
--- €
2019 Q1
2
1 238 €
0
--- €
2018 Q4
9
506 €
0
--- €
2018 Q3
4
865 €
0
--- €
2018 Q2
1
446 €
0
--- €
2018 Q1
2
482 €
0
--- €
2017 Q4
7
959 €
0
--- €
2017 Q3
7
943 €
0
--- €
2017 Q2
6
852 €
0
--- €
2017 Q1
5
946 €
0
--- €
2016 Q4
3
972 €
0
--- €
2016 Q3
2
1 047 €
0
--- €
2016 Q2
4
907 €
0
--- €
2016 Q1
1
1 354 €
0
--- €
2015 Q4
4
676 €
0
--- €
2015 Q3
3
1 015 €
0
--- €
2015 Q2
7
1 292 €
0
--- €
2015 Q1
2
646 €
0
--- €
2014 Q4
5
1 237 €
0
--- €
2014 Q3
3
985 €
0
--- €
2014 Q2
1
468 €
1
746 €
2014 Q1
6
952 €
0
--- €
Key takeaways
What is the price per m2 of houses in Saint-Sulpice-les-Feuilles?
The median price on the 27 house transactions of the last 24 months in the municipality of Saint-Sulpice-les-Feuilles was 936 € per square meter for a median property value of 95 300 €. Over this period, 60% of transactions were between 595 and 1 574 € per square meter (from the 2nd to the 8th deciles).
Compare with neighboring municipalities
City
name
name
house
Price per m²
Price per m²
apt.
Price per m²
Price per m²
City information
Zip code
- 87160 ST SULPICE LES FEUILLES