Median price of real estate
in the municipality of Saint-Junien
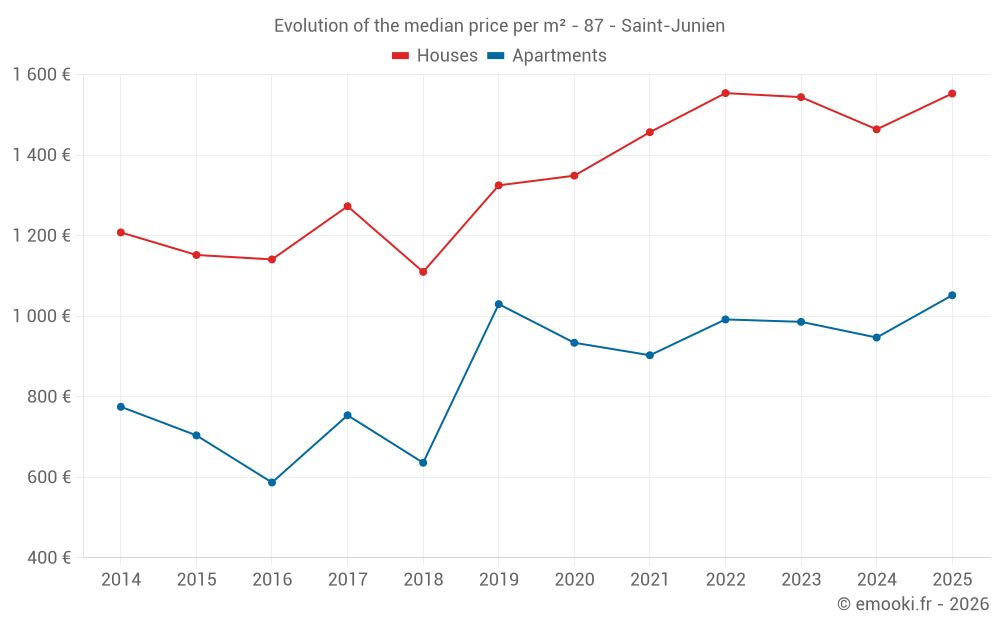
Houses
1 553 € /m²
Reliability 9/10
Median price on the 44 transactions of the last 6 months.
from 1 159 to
2 090 € /m²
2 090 € /m²
60% of transactions from the 2nd to the 8th deciles.
Apartments
1 019 € /m²
Reliability 7/10
Median price on the 21 transactions of the last 24 months.
from 661 to
1 352 € /m²
1 352 € /m²
60% of transactions from the 2nd to the 8th deciles.
Dwellings
1 444 € /m²
Reliability 9/10
Median price on the 52 transactions of the last 6 months.
from 1 015 to
2 012 € /m²
2 012 € /m²
60% of transactions from the 2nd to the 8th deciles.