Real estate price map
Real estate price map in the municipality of Val-d'Oire-et-Gartempe, choose a section to see transactions by parcel.
Haute-Vienne (87)
Price per m² in Val-d'Oire-et-Gartempe
Median price of real estate
in the municipality of Val-d'Oire-et-Gartempe
Houses
658 € /m²
Reliability 9/10
Median price on the 34 transactions of the last 6 months.
from 449 to
1 159 € /m²
1 159 € /m²
60% of transactions from the 2nd to the 8th deciles.
Apartments
509 € /m²
Reliability 1/10
Median price on the 5 transactions of the last 120 months.
Dwellings
658 € /m²
Reliability 9/10
Median price on the 34 transactions of the last 6 months.
from 449 to
1 159 € /m²
1 159 € /m²
60% of transactions from the 2nd to the 8th deciles.
Evolution of the price per m² of houses since...
1 year
-9.3%
2 years
-21%
3 years
-12%
4 years
-10%
5 years
+19%
6 years
-7.6%
7 years
+14%
8 years
+25%
9 years
+11%
10 years
+3.5%
11 years
-7.2%
The price per m² of houses has decreased by 21% since 2 years, but it has increased by 25% in 8 years.
1197 transactions listed in the municipality
Yearly data
Yearly evolution of the median price per m²

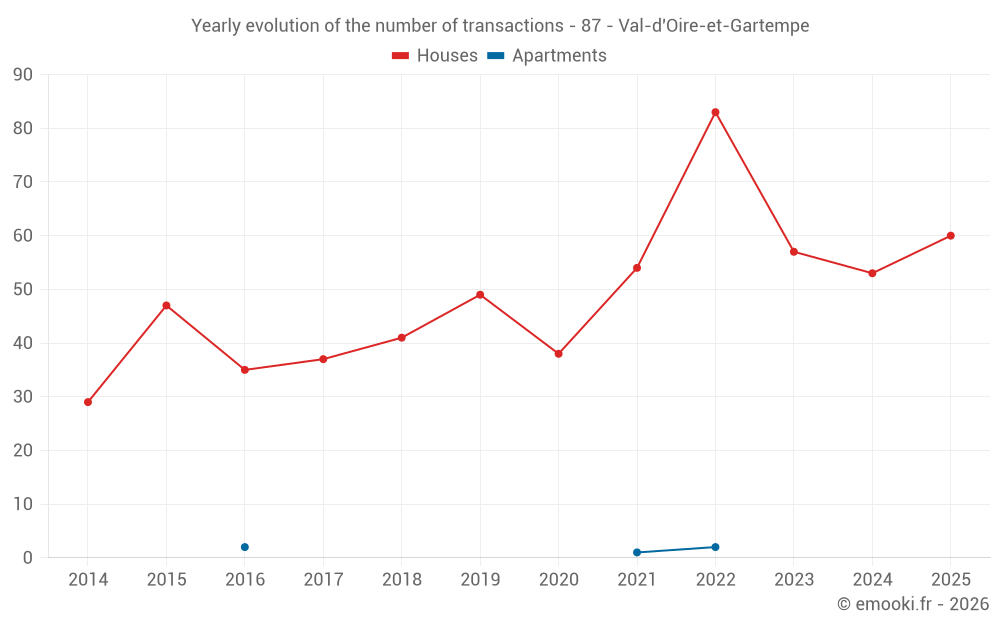
Yearly evolution of the number of transactions
Yearly table
Year
house
transactions
transactions
house
Price per m²
Price per m²
apt.
transactions
transactions
apt.
Price per m²
Price per m²
2025
60
730 €
0
--- €
2024
53
805 €
0
--- €
2023
57
923 €
0
--- €
2022
83
833 €
2
499 €
2021
54
814 €
1
509 €
2020
38
616 €
0
--- €
2019
49
790 €
0
--- €
2018
41
640 €
0
--- €
2017
37
585 €
0
--- €
2016
35
657 €
2
735 €
2015
47
705 €
0
--- €
2014
29
787 €
0
--- €
Analysis
Structure of prices per m²
Values of price percentiles per m² over the periods used for the estimated price of each type of property.
Structure of transaction amounts
Values of transaction amounts percentiles over the periods used for the estimated price of each type of property.
Transaction amounts and prices per m² by percentile
Percentile
house
Price per m²
Price per m²
house
Transaction amount
Transaction amount
apt.
Price per m²
Price per m²
apt.
Transaction amount
Transaction amount
10th percentile
331 €
20 078 €
244 €
37 100 €
20th percentile
449 €
29 000 €
303 €
55 700 €
30th percentile
506 €
31 800 €
368 €
69 000 €
40th percentile
563 €
40 680 €
439 €
77 000 €
50th percentile
658 €
55 000 €
509 €
85 000 €
60th percentile
772 €
80 008 €
631 €
103 K€
70th percentile
1 076 €
86 900 €
752 €
120 K€
80th percentile
1 159 €
123 K€
878 €
152 K€
90th percentile
1 310 €
140 K€
1 007 €
198 K€
National and departmental comparison
Evolution of the median price per m² of houses
Evolution of the median price per m² of apartments
Quarterly data
Quarterly evolution of the median price per m²
Quarterly evolution of the number of transactions
Quarterly table
Quarter
house
transactions
transactions
house
Price per m²
Price per m²
apt.
transactions
transactions
apt.
Price per m²
Price per m²
2025 Q4
17
755 €
0
--- €
2025 Q3
17
573 €
0
--- €
2025 Q2
13
768 €
0
--- €
2025 Q1
13
1 024 €
0
--- €
2024 Q4
13
1 053 €
0
--- €
2024 Q3
18
928 €
0
--- €
2024 Q2
15
498 €
0
--- €
2024 Q1
7
525 €
0
--- €
2023 Q4
16
876 €
0
--- €
2023 Q3
15
1 044 €
0
--- €
2023 Q2
15
789 €
0
--- €
2023 Q1
11
948 €
0
--- €
2022 Q4
16
729 €
1
185 €
2022 Q3
20
946 €
0
--- €
2022 Q2
22
800 €
1
813 €
2022 Q1
25
800 €
0
--- €
2021 Q4
13
814 €
0
--- €
2021 Q3
11
813 €
0
--- €
2021 Q2
16
914 €
1
509 €
2021 Q1
14
678 €
0
--- €
2020 Q4
14
534 €
0
--- €
2020 Q3
7
200 €
0
--- €
2020 Q2
3
1 043 €
0
--- €
2020 Q1
14
808 €
0
--- €
2019 Q4
14
646 €
0
--- €
2019 Q3
9
1 054 €
0
--- €
2019 Q2
13
833 €
0
--- €
2019 Q1
13
867 €
0
--- €
2018 Q4
18
642 €
0
--- €
2018 Q3
8
738 €
0
--- €
2018 Q2
6
611 €
0
--- €
2018 Q1
9
648 €
0
--- €
2017 Q4
11
585 €
0
--- €
2017 Q3
12
726 €
0
--- €
2017 Q2
5
580 €
0
--- €
2017 Q1
9
787 €
0
--- €
2016 Q4
14
764 €
0
--- €
2016 Q3
8
522 €
0
--- €
2016 Q2
7
782 €
1
1 137 €
2016 Q1
6
708 €
1
333 €
2015 Q4
17
705 €
0
--- €
2015 Q3
8
806 €
0
--- €
2015 Q2
14
511 €
0
--- €
2015 Q1
8
882 €
0
--- €
2014 Q4
7
787 €
0
--- €
2014 Q3
6
1 158 €
0
--- €
2014 Q2
7
724 €
0
--- €
2014 Q1
9
727 €
0
--- €
Key takeaways
What is the price per m2 of houses in Val-d'Oire-et-Gartempe?
The median price on the 34 house transactions of the last 6 months in the municipality of Val-d'Oire-et-Gartempe was 658 € per square meter for a median property value of 55 000 €. Over this period, 60% of transactions were between 449 and 1 159 € per square meter (from the 2nd to the 8th deciles).
Compare with neighboring municipalities
City
name
name
house
Price per m²
Price per m²
apt.
Price per m²
Price per m²
City information
Zip codes
- BUSSIERE POITEVINE 87320 VAL D OIRE ET GARTEMPE
- DARNAC 87320 VAL D OIRE ET GARTEMPE
- THIAT 87320 VAL D OIRE ET GARTEMPE
- ST BARBANT 87330 VAL D OIRE ET GARTEMPE