emooki
HomePrice mapTransactions
🇬🇧 English🇫🇷 Français🇩🇪 Deutsch🇪🇸 Español🇮🇹 Italiano

Real estate price map


Real estate price map in the municipality of Rouillé.

Vienne (86)
Rouillé

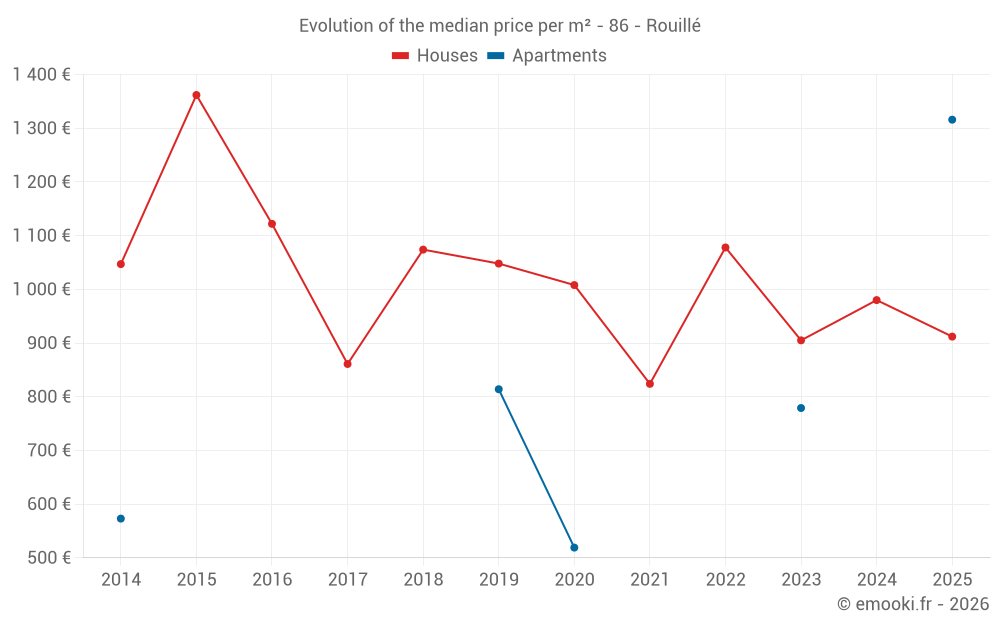
Median price of real estate
in the municipality of Rouillé

HousesHouses
880  /m²
1-23-45-67-89-10
Reliability 8/10
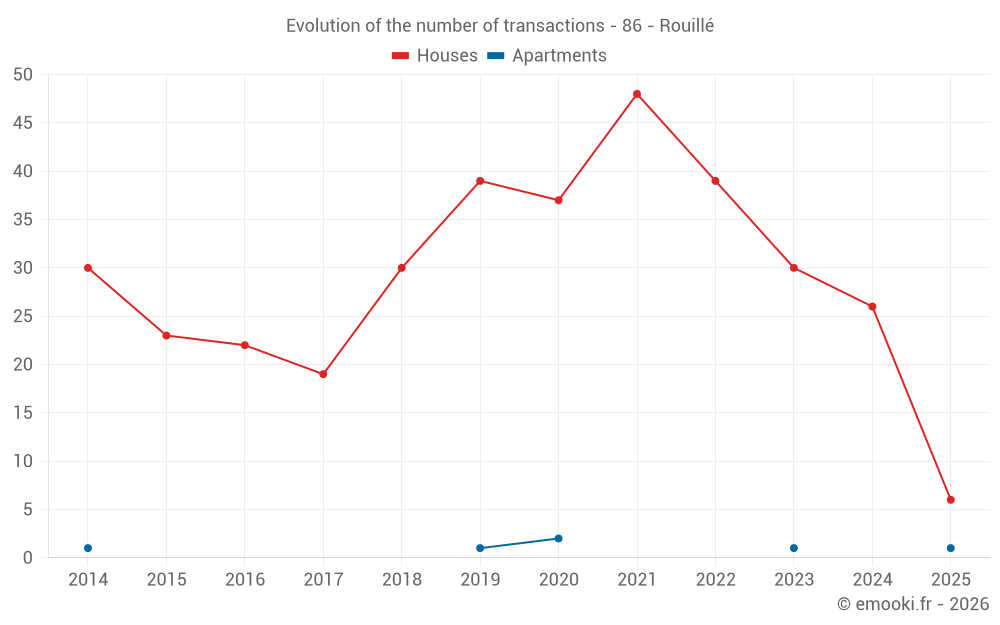
Median price on the 17 transactions of the last 12 months.
from 616 to
1 399  /m²
60% of transactions from the 2nd to the 8th deciles.
ApartmentsApartments
779  /m²
1-23-45-67-89-10
Reliability 2/10
Median price on the 5 transactions of the last 96 months.
DwellingsDwellings
915  /m²
1-23-45-67-89-10
Reliability 8/10
Median price on the 18 transactions of the last 12 months.
from 619 to
1 398  /m²
60% of transactions from the 2nd to the 8th deciles.
HousesEvolution of the price per m² of houses since...
1 year
-6.9%
2 years
+0.8%
3 years
-15%
4 years
+11%
5 years
-10%
6 years
-13%
7 years
-15%
8 years
+5.9%
9 years
-19%
10 years
-33%
11 years
-13%
ApartmentsEvolution of the price per m² of apartments since...
1 year
--
2 years
--
3 years
--
4 years
--
5 years
--
6 years
--
7 years
--
8 years
--
9 years
--
10 years
--
11 years
--

Yearly evolution

Evolution of the median price per m²

Evolution of the number of transactions

Warning, last year incomplete. Projections made based on the proportions between semesters of the previous year at the departmental/national level and by type of property.

Yearly data

Descending order
Year
Houses
house
transactions
Houses
house
Price per m²
Apartments
apt.
transactions
Apartments
apt.
Price per m²
2025
6
912 
1
1 316 
2024
26
980 
0
--- 
2023
30
905 
1
779 
2022
39
1 078 
0
--- 
2021
48
824 
0
--- 
2020
37
1 008 
2
519 
2019
39
1 048 
1
814 
2018
30
1 074 
0
--- 
2017
19
861 
0
--- 
2016
22
1 122 
0
--- 
2015
23
1 362 
0
--- 
2014
30
1 047 
1
573 

Analysis

Structure of prices per m²

Values of price percentiles per m² over the periods used for the estimated price of each type of property.

Structure of transaction amounts

Values of transaction amounts percentiles over the periods used for the estimated price of each type of property.

Transaction amounts and prices per m² by percentile

Ascending order
Percentile
Houses
house
Price per m²
Houses
house
Transaction amount
Apartments
apt.
Price per m²
Apartments
apt.
Transaction amount
10th percentile
468 
22 700 
519 
76 000 
20th percentile
616 
52 000 
519 
92 000 
30th percentile
667 
64 800 
571 
107 K
40th percentile
755 
87 000 
675 
121 K
50th percentile
880 
95 000 
779 
135 K
60th percentile
994 
98 000 
793 
141 K
70th percentile
1 184 
127 K
807 
147 K
80th percentile
1 399 
154 K
914 
192 K
90th percentile
1 487 
182 K
1 115 
278 K

National and departmental comparison

Evolution of the median price per m² of houses

Evolution of the median price per m² of apartments

Quarterly evolution

Evolution of the median price per m²

Evolution of the number of transactions

Quarterly data

Descending order
Quarter
Houses
house
transactions
Houses
house
Price per m²
Apartments
apt.
transactions
Apartments
apt.
Price per m²
2025 Q2
4
762 
0
--- 
2025 Q1
2
1 290 
1
1 316 
2024 Q4
7
677 
0
--- 
2024 Q3
4
1 137 
0
--- 
2024 Q2
7
827 
0
--- 
2024 Q1
8
1 141 
0
--- 
2023 Q4
7
1 000 
0
--- 
2023 Q3
7
692 
0
--- 
2023 Q2
10
1 358 
1
779 
2023 Q1
6
852 
0
--- 
2022 Q4
13
1 184 
0
--- 
2022 Q3
8
1 440 
0
--- 
2022 Q2
12
920 
0
--- 
2022 Q1
6
1 026 
0
--- 
2021 Q4
10
1 221 
0
--- 
2021 Q3
16
1 212 
0
--- 
2021 Q2
10
748 
0
--- 
2021 Q1
12
758 
0
--- 
2020 Q4
11
908 
0
--- 
2020 Q3
8
1 343 
0
--- 
2020 Q2
10
950 
1
519 
2020 Q1
8
846 
1
519 
2019 Q4
7
1 188 
0
--- 
2019 Q3
8
1 127 
0
--- 
2019 Q2
16
1 029 
0
--- 
2019 Q1
8
1 169 
1
814 
2018 Q4
11
945 
0
--- 
2018 Q3
8
1 116 
0
--- 
2018 Q2
7
877 
0
--- 
2018 Q1
4
1 245 
0
--- 
2017 Q4
4
1 209 
0
--- 
2017 Q3
5
1 067 
0
--- 
2017 Q2
5
853 
0
--- 
2017 Q1
5
688 
0
--- 
2016 Q4
6
1 065 
0
--- 
2016 Q3
3
879 
0
--- 
2016 Q2
6
892 
0
--- 
2016 Q1
7
1 340 
0
--- 
2015 Q4
6
1 526 
0
--- 
2015 Q3
9
1 322 
0
--- 
2015 Q2
3
1 333 
0
--- 
2015 Q1
5
756 
0
--- 
2014 Q4
10
834 
1
573 
2014 Q3
10
982 
0
--- 
2014 Q2
4
1 262 
0
--- 
2014 Q1
6
1 528 
0
--- 

Vienne (86)

Most expensive cities

City
name
Descending orderHouses
house
Price per m²
2 451 
2 287 
2 120 
2 097 
2 086 
2 079 
2 058 
City
name
Descending orderApartments
apt.
Price per m²
2 892 
2 121 
2 110 
2 109 
2 016 

Least expensive cities

City
name
Ascending orderHouses
house
Price per m²
400 
558 
585 
596 
608 
624 
City
name
Ascending orderApartments
apt.
Price per m²
219 
294 
296 
320 
365 
371 
382 
386