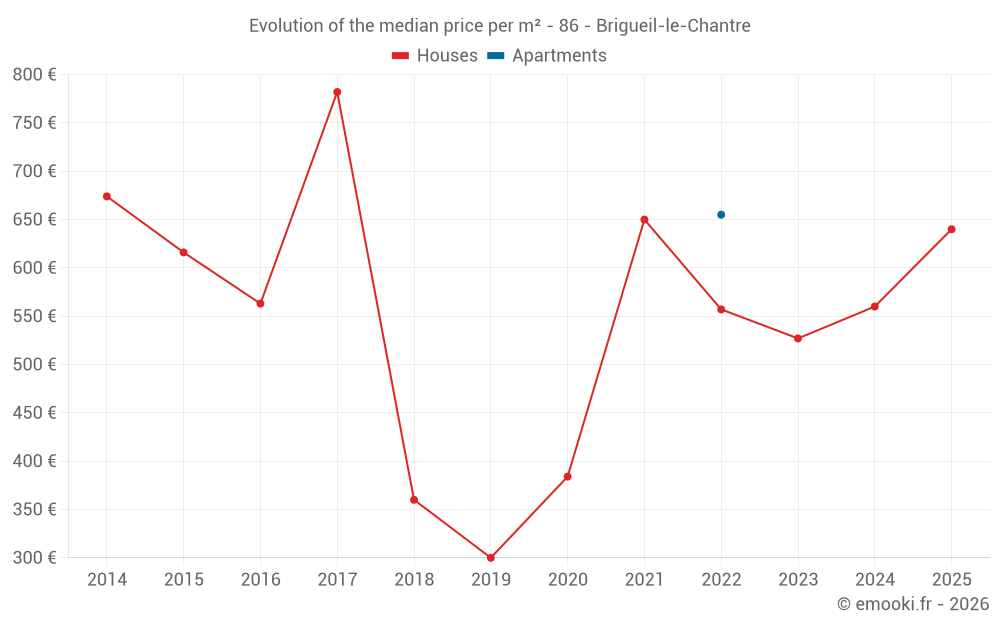
Median price of real estate
in the municipality of Brigueil-le-Chantre
Houses
537 € /m²
Reliability 7/10
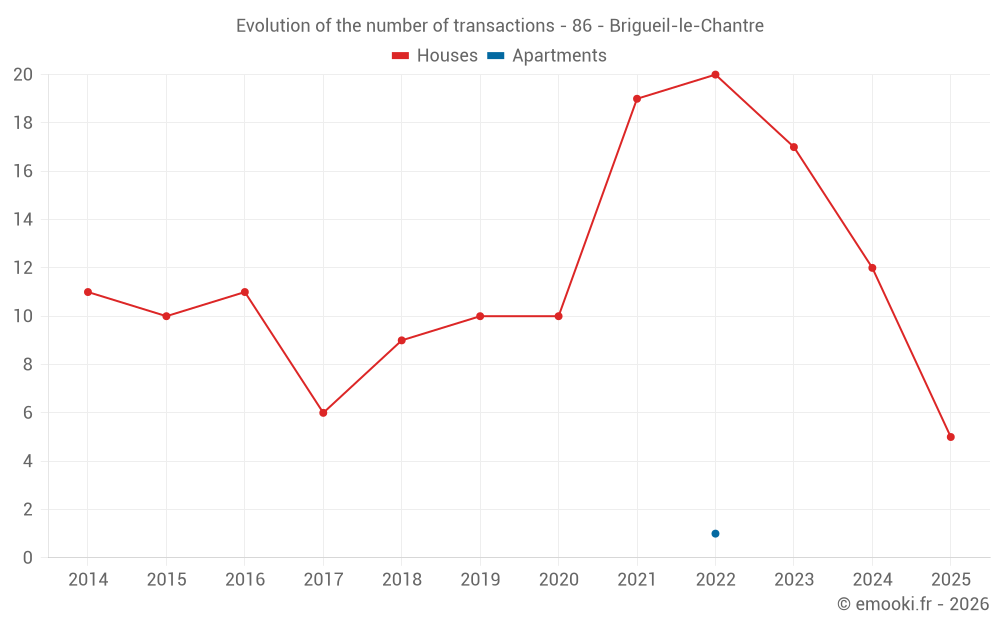
Median price on the 27 transactions of the last 24 months.
from 363 to
1 030 € /m²
1 030 € /m²
60% of transactions from the 2nd to the 8th deciles.
Apartments
655 € /m²
Reliability 1/10
Price of the unique transaction of the last 120 months.
Dwellings
537 € /m²
Reliability 7/10
Median price on the 27 transactions of the last 24 months.
from 363 to
1 030 € /m²
1 030 € /m²
60% of transactions from the 2nd to the 8th deciles.