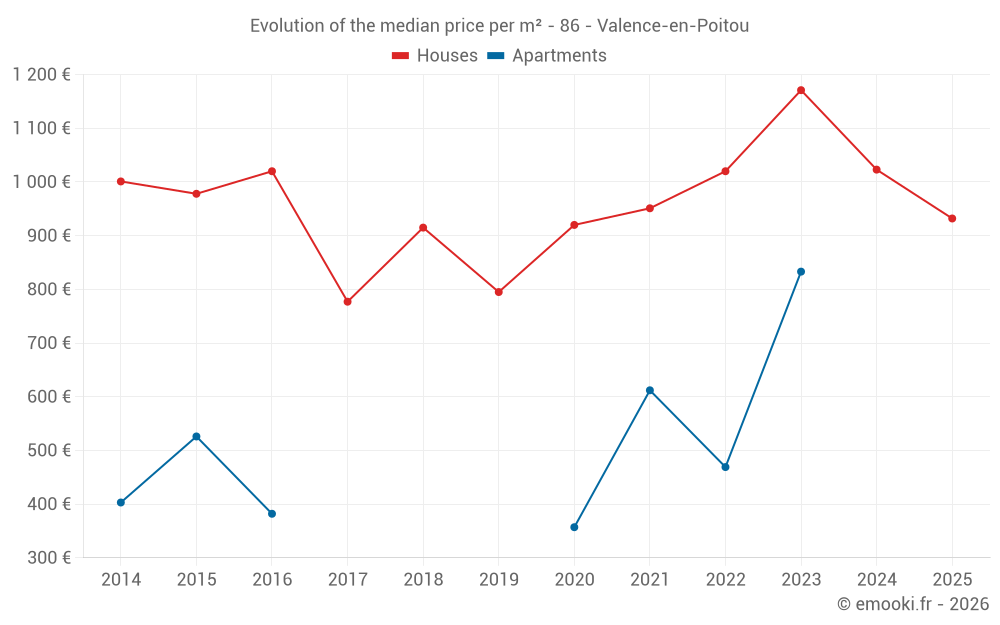
Median price of real estate
in the municipality of Valence-en-Poitou
Houses
932 € /m²
Reliability 9/10
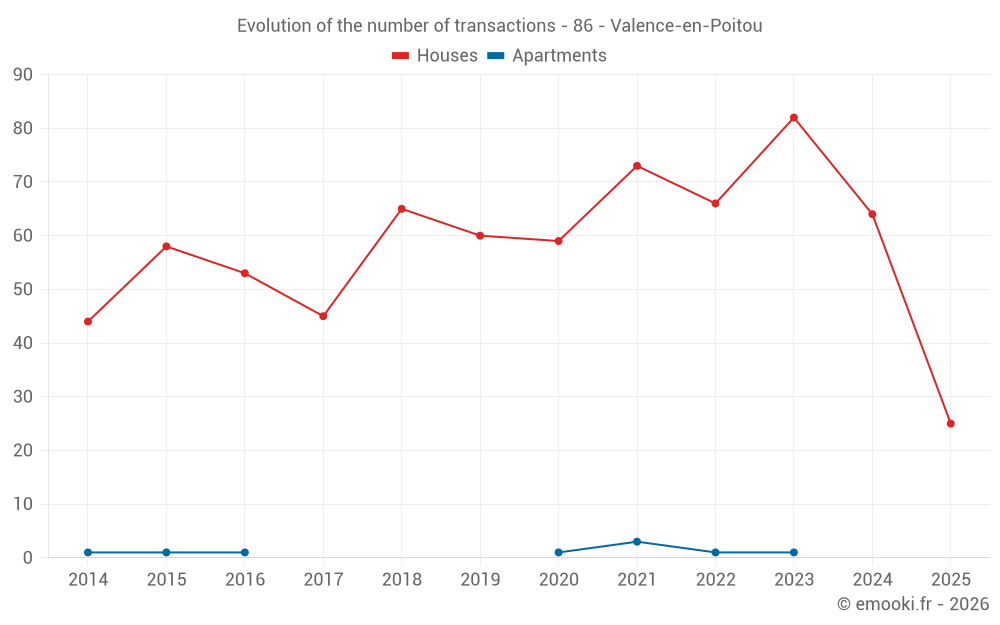
Median price on the 25 transactions of the last 6 months.
from 445 to
1 540 € /m²
1 540 € /m²
60% of transactions from the 2nd to the 8th deciles.
Apartments
540 € /m²
Reliability 3/10
Median price on the 6 transactions of the last 72 months.
Dwellings
932 € /m²
Reliability 9/10
Median price on the 25 transactions of the last 6 months.
from 445 to
1 540 € /m²
1 540 € /m²
60% of transactions from the 2nd to the 8th deciles.