emooki
HomePrice mapTransactions
🇬🇧 English🇫🇷 Français🇩🇪 Deutsch🇪🇸 Español🇮🇹 Italiano

Real estate price map


Real estate price map in the municipality of Sorgues, choose a section to see transactions by parcel.

Vaucluse (84)

Sorgues - Real estate price m²

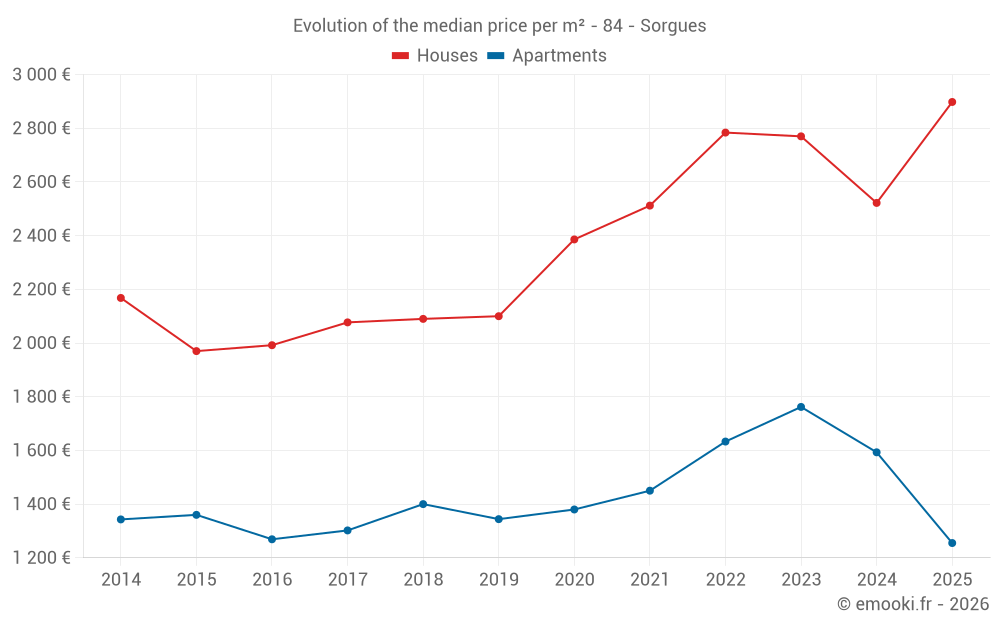
Median price of real estate
in the municipality of Sorgues

HousesHouses
2 916  /m²
1-23-45-67-89-10
Reliability 10/10
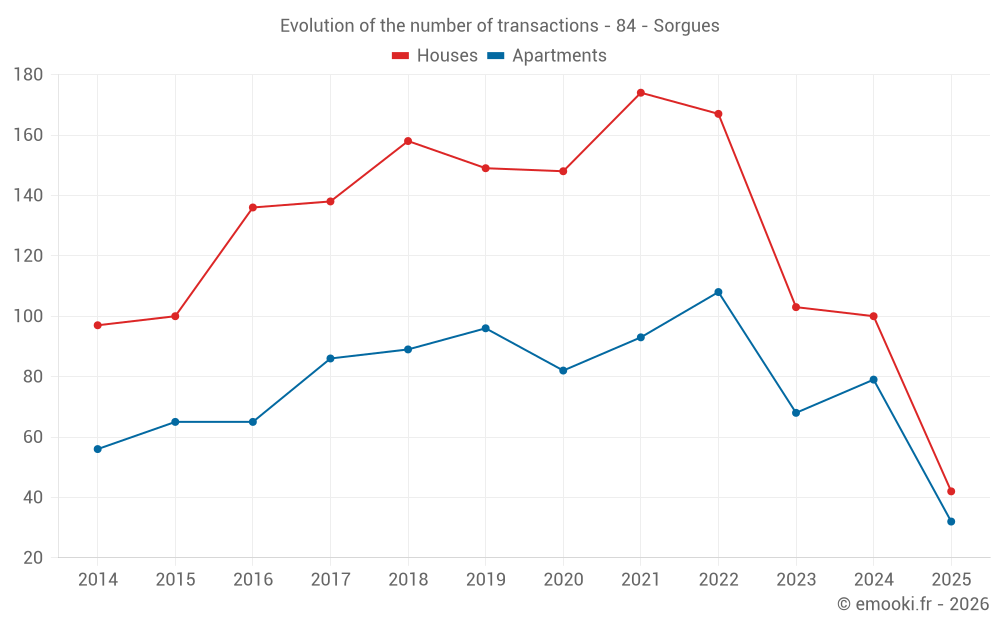
Median price on the 20 transactions of the last 3 months.
from 2 278 to
3 513  /m²
60% of transactions from the 2nd to the 8th deciles.
ApartmentsApartments
1 255  /m²
1-23-45-67-89-10
Reliability 9/10
Median price on the 32 transactions of the last 6 months.
from 956 to
2 059  /m²
60% of transactions from the 2nd to the 8th deciles.
DwellingsDwellings
2 063  /m²
1-23-45-67-89-10
Reliability 10/10
Median price on the 39 transactions of the last 3 months.
from 967 to
3 101  /m²
60% of transactions from the 2nd to the 8th deciles.
HousesEvolution of the price per m² of houses since...
1 year
+15%
2 years
+4.6%
3 years
+4.1%
4 years
+15%
5 years
+21%
6 years
+38%
7 years
+39%
8 years
+40%
9 years
+45%
10 years
+47%
11 years
+34%
ApartmentsEvolution of the price per m² of apartments since...
1 year
-21%
2 years
-29%
3 years
-23%
4 years
-13%
5 years
-9.1%
6 years
-6.6%
7 years
-10%
8 years
-3.6%
9 years
-1.1%
10 years
-7.7%
11 years
-6.6%

Yearly evolution

Evolution of the median price per m²

Evolution of the median price per m² - 84 - Sorgues

Evolution of the number of transactions

Warning, last year incomplete. Projections made based on the proportions between semesters of the previous year at the departmental/national level and by type of property.

Evolution of the number of transactions - 84 - Sorgues

Yearly data

Descending order
Year
Houses
house
transactions
Houses
house
Price per m²
Apartments
apt.
transactions
Apartments
apt.
Price per m²
2025
42
2 898 
32
1 255 
2024
100
2 522 
79
1 593 
2023
103
2 770 
68
1 762 
2022
167
2 784 
108
1 633 
2021
174
2 512 
93
1 450 
2020
148
2 386 
82
1 380 
2019
149
2 100 
96
1 344 
2018
158
2 090 
89
1 400 
2017
138
2 077 
86
1 302 
2016
136
1 992 
65
1 269 
2015
100
1 970 
65
1 360 
2014
97
2 168 
56
1 343 

Analysis

Structure of prices per m²

Values of price percentiles per m² over the periods used for the estimated price of each type of property.

Structure of transaction amounts

Values of transaction amounts percentiles over the periods used for the estimated price of each type of property.

Transaction amounts and prices per m² by percentile

Ascending order
Percentile
Houses
house
Price per m²
Houses
house
Transaction amount
Apartments
apt.
Price per m²
Apartments
apt.
Transaction amount
10th percentile
1 842 
175 K
875 
51 300 
20th percentile
2 278 
220 K
956 
55 066 
30th percentile
2 631 
231 K
1 038 
59 144 
40th percentile
2 854 
253 K
1 134 
65 200 
50th percentile
2 916 
271 K
1 255 
78 000 
60th percentile
3 101 
286 K
1 521 
93 800 
70th percentile
3 306 
306 K
1 832 
106 K
80th percentile
3 513 
343 K
2 059 
127 K
90th percentile
3 744 
461 K
2 350 
146 K

National and departmental comparison

Evolution of the median price per m² of houses

Evolution of the median price per m² of apartments

Quarterly evolution

Evolution of the median price per m²

Evolution of the number of transactions

Quarterly data

Descending order
Quarter
Houses
house
transactions
Houses
house
Price per m²
Apartments
apt.
transactions
Apartments
apt.
Price per m²
2025 Q2
20
2 916 
19
1 056 
2025 Q1
22
2 850 
13
1 367 
2024 Q4
28
2 474 
20
1 510 
2024 Q3
27
2 543 
20
1 530 
2024 Q2
18
2 445 
20
1 719 
2024 Q1
27
2 568 
19
1 593 
2023 Q4
21
2 717 
15
1 602 
2023 Q3
30
2 668 
21
1 692 
2023 Q2
22
2 727 
18
1 871 
2023 Q1
30
2 933 
14
1 810 
2022 Q4
30
2 933 
29
1 844 
2022 Q3
44
2 915 
28
1 818 
2022 Q2
42
2 756 
18
1 471 
2022 Q1
51
2 647 
33
1 477 
2021 Q4
44
2 434 
24
1 859 
2021 Q3
59
2 528 
28
1 396 
2021 Q2
44
2 456 
24
1 398 
2021 Q1
27
2 525 
17
1 362 
2020 Q4
56
2 384 
30
1 400 
2020 Q3
30
2 443 
12
1 155 
2020 Q2
31
2 172 
23
1 366 
2020 Q1
31
2 383 
17
1 528 
2019 Q4
39
2 100 
37
1 463 
2019 Q3
47
2 155 
29
1 257 
2019 Q2
30
2 243 
16
1 446 
2019 Q1
33
2 071 
14
1 098 
2018 Q4
38
1 969 
19
1 600 
2018 Q3
45
2 097 
27
1 458 
2018 Q2
42
2 250 
30
1 219 
2018 Q1
33
2 055 
13
1 583 
2017 Q4
32
2 140 
16
1 222 
2017 Q3
41
2 058 
30
1 373 
2017 Q2
33
2 162 
20
1 328 
2017 Q1
32
1 848 
20
1 330 
2016 Q4
40
1 995 
15
1 201 
2016 Q3
36
2 172 
18
1 436 
2016 Q2
34
1 860 
22
1 216 
2016 Q1
26
1 860 
10
1 316 
2015 Q4
30
1 792 
14
1 368 
2015 Q3
24
2 120 
20
1 390 
2015 Q2
25
1 665 
19
1 370 
2015 Q1
21
2 222 
12
1 346 
2014 Q4
29
2 050 
14
1 135 
2014 Q3
30
2 154 
14
1 336 
2014 Q2
21
2 278 
15
1 322 
2014 Q1
17
2 010 
13
1 537 

Overview of the latest real estate transactions

The following list is an anonymized overview of the latest transactions. For more details and to find all transactions, please use the map to view transactions by plot or the transaction search page for a search by criteria.

2025-06-26
147 000 
1 861  /m²(79 m²)
Sale
Apartments
Apartment
4 rooms
79 m2
1 outbuilding
2025-06-24
12 000 
Sale
Land
1067 m2
-Landes
2025-06-24
64 000 
1 123  /m²(57 m²)
Sale
Apartments
Apartment
3 rooms
57 m2
1 outbuilding
2025-06-20
340 000 
1 988  /m²(171 m²)
Sale
Apartments
Apartment
3 rooms
70 m2
Houses
House
5 rooms
101 m2
1 outbuilding
Land
737 m2
-Sols
2025-06-17
295 550 
3 321  /m²(89 m²)
Sale
Houses
House
4 rooms
89 m2
Land
514 m2
-Sols
Land
1045 m2
-Sols
2025-06-12
92 000 
2 044  /m²(45 m²)
Sale
Apartments
Apartment
2 rooms
45 m2
1 outbuilding
2025-06-11
62 700 
883  /m²(71 m²)
Sale
Apartments
Apartment
4 rooms
71 m2
1 outbuilding
2025-06-10
90 000 
transaction.nature.Vente terrain à bâtir
Land
351 m2
-Landes
2025-06-03
100 000 
1 754  /m²(57 m²)
Sale
Apartments
Apartment
2 rooms
57 m2
2 outbuildings
2025-05-27
1 219 887 
4 569  /m²(267 m²)
Sale
Apartments
Apartment
1 room
30 m2
2 outbuildings
Land
258 m2
-Sols
Houses
House
7 rooms
237 m2
2 outbuildings
Land
1558 m2
-Sols
2025-05-27
54 000 
947  /m²(57 m²)
Sale
Apartments
Apartment
3 rooms
57 m2
1 outbuilding
2025-05-21
296 950 
3 228  /m²(92 m²)
Sale
Houses
House
4 rooms
92 m2
1 outbuilding
Land
455 m2
-Sols
2025-05-20
76 000 
1 056  /m²(72 m²)
Sale
Apartments
Apartment
4 rooms
72 m2
1 outbuilding
1 outbuilding
2025-05-20
744 050 
3 510  /m²(212 m²)
Sale
Houses
House
8 rooms
212 m2
1 outbuilding
Land
1338 m2
-Sols
Land
1373 m2
-Vignes
2025-05-19
20 000 
Sale
Land
756 m2
-Terrains d'agrément
Land
878 m2
-Terrains d'agrément
2025-05-16
84 500 
transaction.nature.Vente terrain à bâtir
Land
351 m2
-Landes
2025-05-16
84 500 
transaction.nature.Vente terrain à bâtir
Land
340 m2
-Landes
2025-05-16
55 100 
2 119  /m²(26 m²)
Sale
Apartments
Apartment
1 room
26 m2
2025-05-07
3 000 
Sale
Land
101 m2
-Sols
2025-05-07
203 325 
2 864  /m²(71 m²)
Sale
Houses
House
3 rooms
71 m2
3644 transactions listed in the municipality

Vaucluse (84)

Most expensive cities

City
name
Descending orderHouses
house
Price per m²
6 530 
5 858 
5 508 
5 477 
5 297 
5 055 
5 000 
4 793 
4 691 
City
name
Descending orderApartments
apt.
Price per m²
4 566 
4 536 
3 739 
3 696 
3 693 
3 580 
3 536 

Least expensive cities

City
name
Ascending orderHouses
house
Price per m²
1 333 
1 706 
1 790 
1 835 
2 000 
2 025 
2 066 
City
name
Ascending orderApartments
apt.
Price per m²
588 
1 000 
1 081 
1 136 
1 150 
1 226 
1 228 
1 230 
1 254