emooki
HomePrice mapTransactions
🇬🇧 English🇫🇷 Français🇩🇪 Deutsch🇪🇸 Español🇮🇹 Italiano

Real estate price map


Real estate price map in the municipality of Pernes-les-Fontaines, choose a section to see transactions by parcel.

Vaucluse (84)
Pernes-les-Fontaines

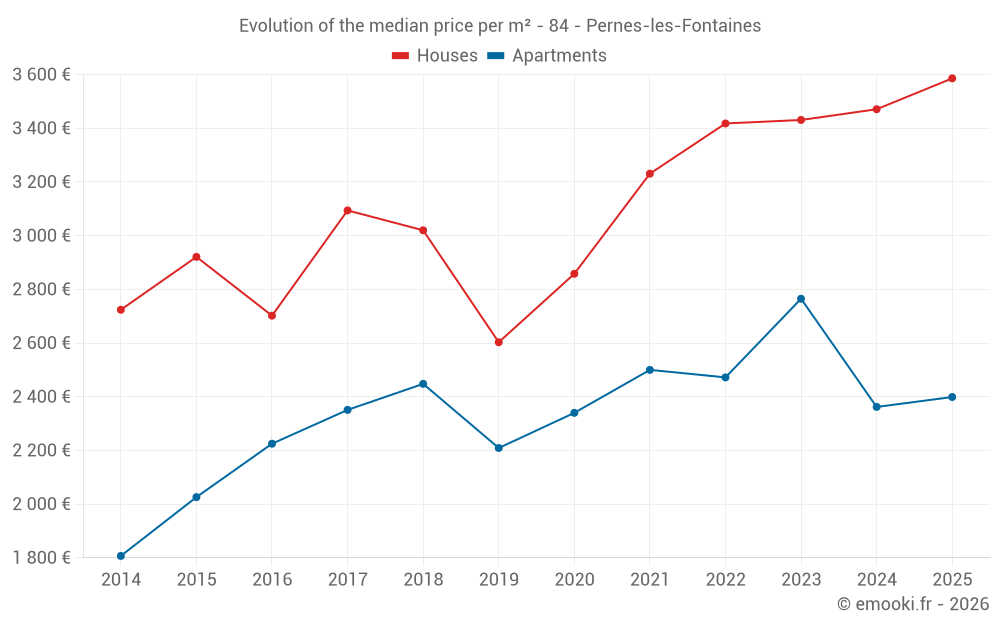
Median price of real estate
in the municipality of Pernes-les-Fontaines

HousesHouses
3 433 € /m²
1-23-45-67-89-10
Reliability 10/10
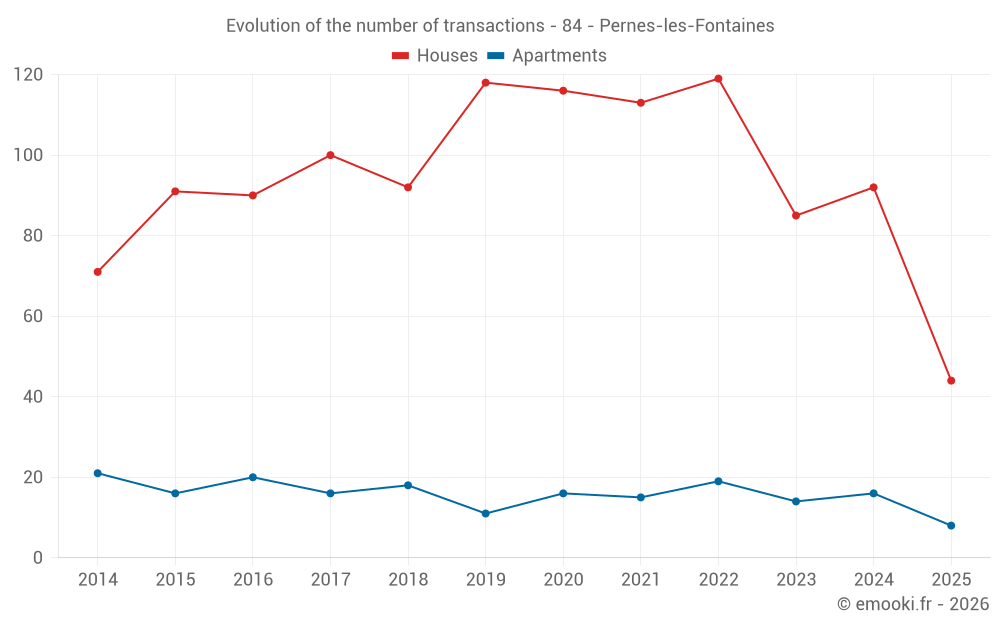
Median price on the 23 transactions of the last 3 months.
from 2 916 to
5 419 € /m²
60% of transactions from the 2nd to the 8th deciles.
ApartmentsApartments
2 362 € /m²
1-23-45-67-89-10
Reliability 8/10
Median price on the 18 transactions of the last 12 months.
from 1 803 to
3 228 € /m²
60% of transactions from the 2nd to the 8th deciles.
DwellingsDwellings
3 365 € /m²
1-23-45-67-89-10
Reliability 10/10
Median price on the 27 transactions of the last 3 months.
from 2 564 to
5 476 € /m²
60% of transactions from the 2nd to the 8th deciles.
HousesEvolution of the price per m² of houses since...
1 year
+3.3%
2 years
+4.5%
3 years
+4.9%
4 years
+11%
5 years
+25%
6 years
+38%
7 years
+19%
8 years
+16%
9 years
+33%
10 years
+23%
11 years
+32%
ApartmentsEvolution of the price per m² of apartments since...
1 year
+1.6%
2 years
-13%
3 years
-3%
4 years
-4%
5 years
+2.5%
6 years
+8.6%
7 years
-2%
8 years
+2%
9 years
+7.8%
10 years
+18%
11 years
+33%
The price per m² of apartments has decreased by 13% since 2 years, but it has increased by 33% in 11 years.

Yearly evolution

Evolution of the median price per m²

Evolution of the number of transactions

Warning, last year incomplete. Projections made based on the proportions between semesters of the previous year at the departmental/national level and by type of property.

Yearly data

Descending order
Year
Houses
house
transactions
Houses
house
Price per m²
Apartments
apt.
transactions
Apartments
apt.
Price per m²
2025
44
3 586 €
8
2 399 €
2024
92
3 471 €
16
2 362 €
2023
85
3 431 €
14
2 765 €
2022
119
3 418 €
19
2 472 €
2021
113
3 231 €
15
2 500 €
2020
116
2 858 €
16
2 340 €
2019
118
2 603 €
11
2 209 €
2018
92
3 020 €
18
2 448 €
2017
100
3 094 €
16
2 351 €
2016
90
2 702 €
20
2 225 €
2015
91
2 921 €
16
2 026 €
2014
71
2 724 €
21
1 807 €

Analysis

Structure of prices per m²

Values of price percentiles per m² over the periods used for the estimated price of each type of property.

Structure of transaction amounts

Values of transaction amounts percentiles over the periods used for the estimated price of each type of property.

Transaction amounts and prices per m² by percentile

Ascending order
Percentile
Houses
house
Price per m²
Houses
house
Transaction amount
Apartments
apt.
Price per m²
Apartments
apt.
Transaction amount
10th percentile
2 564 €
224 K€
1 684 €
83 500 €
20th percentile
2 916 €
276 K€
1 803 €
110 K€
30th percentile
3 046 €
310 K€
1 853 €
120 K€
40th percentile
3 268 €
333 K€
1 963 €
187 K€
50th percentile
3 433 €
396 K€
2 362 €
202 K€
60th percentile
3 785 €
418 K€
2 560 €
220 K€
70th percentile
4 774 €
448 K€
2 941 €
221 K€
80th percentile
5 419 €
606 K€
3 228 €
370 K€
90th percentile
6 310 €
727 K€
3 686 €
530 K€

National and departmental comparison

Evolution of the median price per m² of houses

Evolution of the median price per m² of apartments

Quarterly evolution

Evolution of the median price per m²

Evolution of the number of transactions

Quarterly data

Descending order
Quarter
Houses
house
transactions
Houses
house
Price per m²
Apartments
apt.
transactions
Apartments
apt.
Price per m²
2025 Q2
23
3 433 €
4
1 845 €
2025 Q1
21
3 638 €
4
3 141 €
2024 Q4
21
3 095 €
4
2 150 €
2024 Q3
28
3 581 €
6
2 674 €
2024 Q2
28
3 104 €
2
2 294 €
2024 Q1
15
3 815 €
4
2 471 €
2023 Q4
23
3 805 €
2
4 714 €
2023 Q3
14
2 969 €
6
2 765 €
2023 Q2
26
3 646 €
4
3 394 €
2023 Q1
22
3 224 €
2
2 064 €
2022 Q4
20
3 744 €
1
2 786 €
2022 Q3
27
3 156 €
6
2 020 €
2022 Q2
34
3 325 €
6
2 086 €
2022 Q1
38
3 702 €
6
2 752 €
2021 Q4
30
3 309 €
7
2 531 €
2021 Q3
21
3 838 €
4
2 323 €
2021 Q2
31
2 820 €
0
--- €
2021 Q1
31
2 867 €
4
2 446 €
2020 Q4
35
2 917 €
4
2 393 €
2020 Q3
32
2 932 €
8
1 913 €
2020 Q2
20
2 634 €
1
2 938 €
2020 Q1
29
2 781 €
3
2 394 €
2019 Q4
49
2 153 €
3
1 875 €
2019 Q3
25
2 307 €
3
2 616 €
2019 Q2
21
2 788 €
2
2 148 €
2019 Q1
23
2 964 €
3
2 027 €
2018 Q4
22
3 206 €
4
2 156 €
2018 Q3
34
3 101 €
2
2 722 €
2018 Q2
21
2 977 €
7
2 619 €
2018 Q1
15
2 459 €
5
1 915 €
2017 Q4
30
3 216 €
3
2 500 €
2017 Q3
24
2 846 €
5
2 682 €
2017 Q2
17
3 109 €
5
2 125 €
2017 Q1
29
3 080 €
3
1 453 €
2016 Q4
22
2 978 €
5
2 573 €
2016 Q3
24
2 772 €
5
1 321 €
2016 Q2
20
2 362 €
4
2 336 €
2016 Q1
24
2 570 €
6
2 085 €
2015 Q4
22
2 889 €
5
2 301 €
2015 Q3
24
3 022 €
5
2 012 €
2015 Q2
26
2 928 €
2
4 092 €
2015 Q1
19
2 806 €
4
1 666 €
2014 Q4
12
2 226 €
3
2 616 €
2014 Q3
24
2 809 €
6
2 036 €
2014 Q2
19
2 637 €
9
1 807 €
2014 Q1
16
2 718 €
3
1 250 €

Overview of the latest real estate transactions

The following list is an anonymized overview of the latest transactions. For more details and to find all transactions, please use the map to view transactions by plot or the transaction search page for a search by criteria.

2025-06-30
432 100 €
4 155 € /m²(104 m²)
Sale
Houses
House
5 rooms
104 m2
1 outbuilding
Land
530 m2
-Sols
Land
5 m2
-Sols
2025-06-24
1 000 €
Sale
Land
740 m2
-Bois
2025-06-17
570 000 €
5 534 € /m²(103 m²)
Sale
Houses
House
3 rooms
103 m2
1 outbuilding
Land
754 m2
-Sols
2025-06-12
413 000 €
Sale
Land
468 m2
-Terres
2025-06-05
421 500 €
1 849 € /m²(228 m²)
Sale
Apartments
Apartment
4 rooms
125 m2
Apartments
Apartment
4 rooms
103 m2
4 outbuildings
Land
1189 m2
-Sols
Land
912 m2
-Sols
2025-06-02
104 200 €
827 € /m²(126 m²)
1 389 € /m²(75 m²)
Sale
Houses
House
3 rooms
75 m2
Commercial property
51 m2
Land
103 m2
-Sols
2025-05-28
968 935 €
11 267 € /m²(86 m²)
Sale
Houses
House
3 rooms
86 m2
1 outbuilding
Land
500 m2
-Sols
Land
703 m2
-Terres
2025-05-28
635 970 €
3 365 € /m²(189 m²)
Sale
Houses
House
4 rooms
189 m2
2 outbuildings
Land
2500 m2
-Bois
Land
500 m2
-Sols
2025-05-28
396 000 €
6 387 € /m²(62 m²)
Sale
Houses
House
3 rooms
62 m2
1 outbuilding
Land
890 m2
-Sols
2025-05-28
1 547 820 €
8 745 € /m²(177 m²)
Sale
Houses
House
6 rooms
177 m2
1 outbuilding
Land
2766 m2
-Vergers
/Oliveraie ou oliviers
Land
1000 m2
-Sols
Land
234 m2
-Bois
Land
1891 m2
-Bois
2025-05-21
335 950 €
2 871 € /m²(117 m²)
Sale
Houses
House
3 rooms
117 m2
Land
65 m2
-Sols
Land
83 m2
-Sols
2025-05-21
356 950 €
4 697 € /m²(76 m²)
Sale
Houses
House
3 rooms
76 m2
Land
530 m2
-Sols
Land
59 m2
-Terres
2025-05-19
179 000 €
2 983 € /m²(60 m²)
Sale
1 outbuilding
Houses
House
3 rooms
60 m2
Land
40 m2
-Sols
2025-05-16
313 000 €
2 820 € /m²(111 m²)
Sale
Houses
House
5 rooms
111 m2
Land
374 m2
-Sols
2025-05-15
1 200 €
Sale
Land
1140 m2
-Vergers
2025-05-15
210 000 €
Sale
Land
935 m2
-Terres
2025-05-15
629 467 €
5 246 € /m²(120 m²)
Sale
Houses
House
4 rooms
120 m2
1 outbuilding
Land
356 m2
-Sols
Land
379 m2
-Jardins
2025-05-13
1 000 €
Sale
Land
80 m2
-Sols
2025-05-06
52 618 €
Sale
Land
7215 m2
-Terres
Land
1440 m2
-Terres
Land
1795 m2
-Terres
Land
1220 m2
-Terres
Land
910 m2
-Terres
Land
3480 m2
-Terres
Land
785 m2
-Terres
Land
1635 m2
-Terres
Land
8530 m2
-Terres
Land
3590 m2
-Terres
Land
4295 m2
-Terres
Land
1080 m2
-Terres
Land
1065 m2
-Terres
Land
1210 m2
-Terres
Land
3300 m2
-Terres
2025-05-05
115 000 €
Sale
Land
790 m2
-Terres
2406 transactions listed in the municipality

Vaucluse (84)

Most expensive cities

City
name
Descending orderHouses
house
Price per m²
6 530 €
5 858 €
5 508 €
5 477 €
5 297 €
5 055 €
5 000 €
4 793 €
4 691 €
4 643 €
City
name
Descending orderApartments
apt.
Price per m²
17 038 €
4 566 €
4 536 €
3 739 €
3 696 €
3 693 €
3 595 €
3 587 €
3 580 €
3 536 €

Least expensive cities

City
name
Ascending orderHouses
house
Price per m²
1 333 €
1 464 €
1 706 €
1 790 €
1 835 €
1 904 €
2 000 €
2 025 €
2 066 €
2 099 €
City
name
Ascending orderApartments
apt.
Price per m²
588 €
1 000 €
1 009 €
1 081 €
1 136 €
1 150 €
1 226 €
1 228 €
1 230 €
1 254 €