emooki
HomePrice mapTransactions
🇬🇧 English🇫🇷 Français🇩🇪 Deutsch🇪🇸 Español🇮🇹 Italiano

Real estate price map


Real estate price map in the municipality of Crestet.

Vaucluse (84)
Crestet

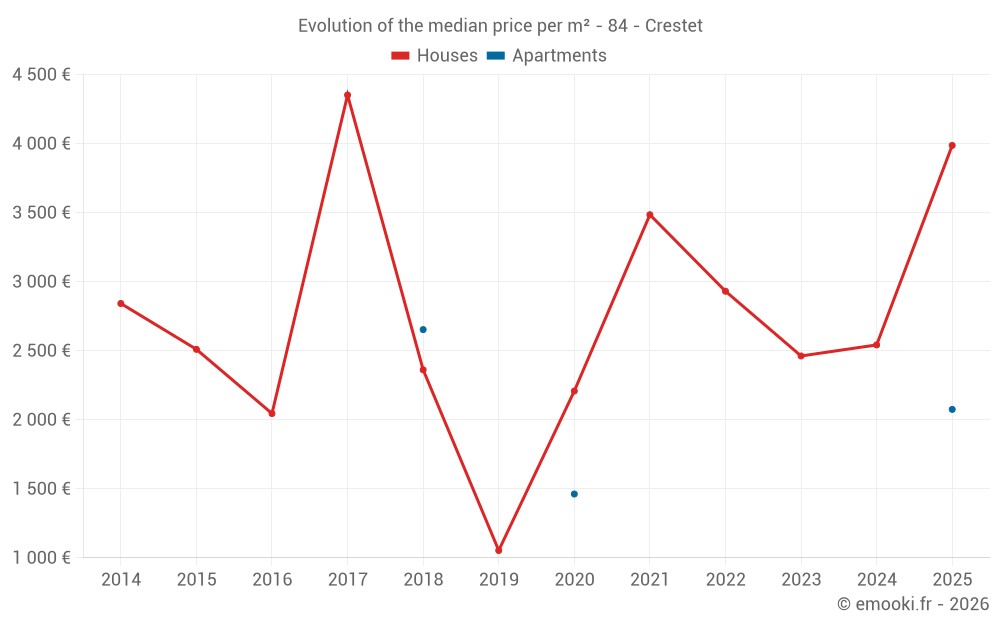
Median price of real estate
in the municipality of Crestet

HousesHouses
2 931 € /m²
1-23-45-67-89-10
Reliability 5/10
Median price on the 17 transactions of the last 48 months.
from 2 344 to
3 652 € /m²
60% of transactions from the 2nd to the 8th deciles.
ApartmentsApartments
1 877 € /m²
1-23-45-67-89-10
Reliability 3/10
Median price on the 7 transactions of the last 72 months.
DwellingsDwellings
2 390 € /m²
1-23-45-67-89-10
Reliability 6/10
Median price on the 16 transactions of the last 36 months.
from 1 434 to
3 429 € /m²
60% of transactions from the 2nd to the 8th deciles.
HousesEvolution of the price per m² of houses
1 year
--
2 years
--
3 years
--
4 years
--
5 years
--
6 years
--
7 years
--
8 years
--
9 years
--
10 years
--
11 years
--
ApartmentsEvolution of the price per m² of apartments
1 year
--
2 years
--
3 years
--
4 years
--
5 years
--
6 years
--
7 years
--
8 years
--
9 years
--
10 years
--
11 years
--

Yearly evolution

Median price per m²

Number of transactions

Warning, last year incomplete. Projections made based on the proportions between semesters of the previous year at the departmental/national level and by type of property.

Yearly data

Descending order
Year
Houses
house
Price per m²
Houses
house
transactions
Apartments
apt.
Price per m²
Apartments
apt.
transactions
2025
3 987 €
1
2 075 €
6
2024
2 542 €
5
--- €
0
2023
2 462 €
3
--- €
0
2022
2 931 €
3
--- €
0
2021
3 485 €
7
--- €
0
2020
2 208 €
5
1 462 €
1
2019
1 053 €
3
--- €
0
2018
2 362 €
8
2 653 €
1
2017
4 352 €
2
--- €
0
2016
2 045 €
7
--- €
0
2015
2 510 €
4
--- €
0
2014
2 842 €
2
--- €
0

Analysis

Structure of prices per m²

Values of price percentiles per m² over the periods used for the estimated price of each type of property.

Structure of transaction amounts

Values of transaction amounts percentiles over the periods used for the estimated price of each type of property.

Transaction amounts and prices per m² by percentile

Ascending order
Percentile
Houses
house
Price per m²
Houses
house
Transaction amount
Apartments
apt.
Price per m²
Apartments
apt.
Transaction amount
10th percentile
1 559 €
177 280 €
1 428 €
178 490 €
20th percentile
2 344 €
190 400 €
1 440 €
180 943 €
30th percentile
2 526 €
214 400 €
1 456 €
186 038 €
40th percentile
2 730 €
260 000 €
1 628 €
188 642 €
50th percentile
2 931 €
340 000 €
1 877 €
190 000 €
60th percentile
3 306 €
424 176 €
2 115 €
226 000 €
70th percentile
3 506 €
508 000 €
2 282 €
255 660 €
80th percentile
3 652 €
557 600 €
2 310 €
272 642 €
90th percentile
4 254 €
674 588 €
2 476 €
297 170 €

Quarterly evolution

Median price per m²

Number of transactions

Quarterly data

Descending order
Quarter
Houses
house
Price per m²
Houses
house
transactions
Apartments
apt.
Price per m²
Apartments
apt.
transactions
2025 Q2
3 987 €
1
--- €
0
2025 Q1
--- €
0
2 075 €
6
2024 Q4
2 718 €
2
--- €
0
2024 Q2
1 368 €
1
--- €
0
2024 Q1
2 986 €
2
--- €
0
2023 Q3
3 592 €
1
--- €
0
2023 Q2
1 862 €
2
--- €
0
2022 Q4
4 655 €
1
--- €
0
2022 Q2
2 931 €
1
--- €
0
2022 Q1
1 686 €
1
--- €
0
2021 Q4
4 891 €
1
--- €
0
2021 Q3
3 140 €
4
--- €
0
2021 Q2
6 234 €
1
--- €
0
2021 Q1
2 063 €
1
--- €
0
2020 Q4
2 872 €
2
--- €
0
2020 Q3
1 570 €
1
--- €
0
2020 Q2
2 208 €
1
1 462 €
1
2020 Q1
3 289 €
1
--- €
0
2019 Q4
790 €
1
--- €
0
2019 Q3
6 778 €
1
--- €
0
2019 Q2
1 053 €
1
--- €
0
2018 Q4
2 053 €
3
2 653 €
1
2018 Q3
3 243 €
3
--- €
0
2018 Q2
4 002 €
2
--- €
0
2017 Q3
2 433 €
1
--- €
0
2017 Q2
6 271 €
1
--- €
0
2016 Q4
1 678 €
2
--- €
0
2016 Q3
3 130 €
3
--- €
0
2016 Q2
3 396 €
2
--- €
0
2015 Q4
6 250 €
1
--- €
0
2015 Q3
1 452 €
1
--- €
0
2015 Q2
2 583 €
1
--- €
0
2015 Q1
2 438 €
1
--- €
0
2014 Q4
2 972 €
1
--- €
0
2014 Q3
2 713 €
1
--- €
0

Vaucluse (84)

Most expensive cities

City
name
Descending orderHouses
house
Price per m²
6 530 €
5 858 €
5 508 €
5 477 €
5 297 €
5 055 €
5 000 €
4 793 €
4 691 €
4 643 €
City
name
Descending orderApartments
apt.
Price per m²
17 038 €
4 566 €
4 536 €
3 739 €
3 696 €
3 693 €
3 595 €
3 587 €
3 580 €
3 536 €

Least expensive cities

City
name
Ascending orderHouses
house
Price per m²
1 333 €
1 464 €
1 706 €
1 790 €
1 835 €
1 904 €
2 000 €
2 025 €
2 066 €
2 099 €
City
name
Ascending orderApartments
apt.
Price per m²
588 €
1 000 €
1 009 €
1 081 €
1 136 €
1 150 €
1 226 €
1 228 €
1 230 €
1 254 €