Median price of real estate
in the municipality of Cadenet
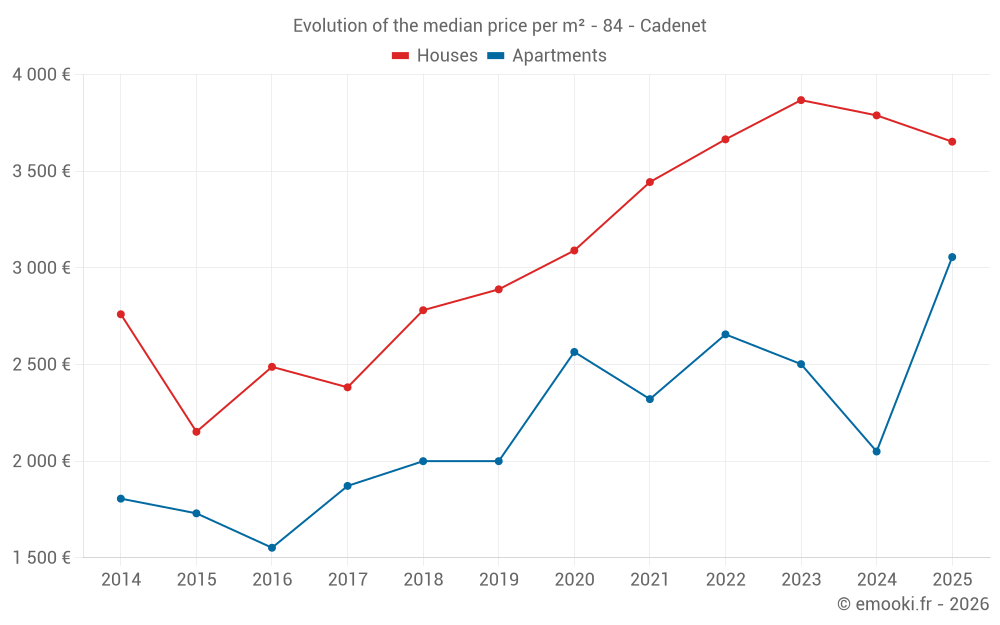
Houses
3 692 € /m²
Reliability 8/10
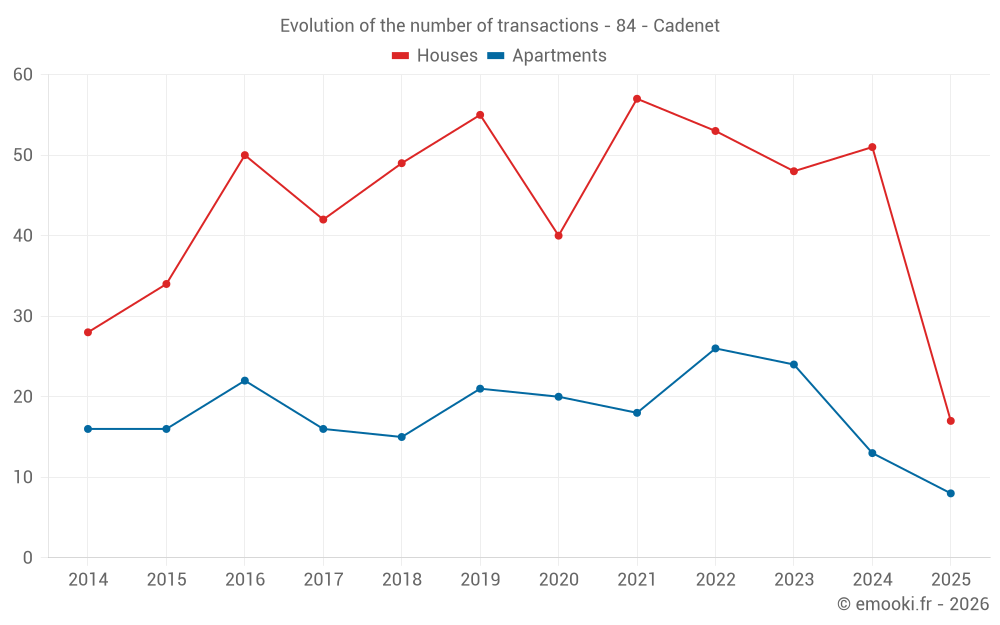
Median price on the 46 transactions of the last 12 months.
from 2 446 to
4 770 € /m²
4 770 € /m²
60% of transactions from the 2nd to the 8th deciles.
Apartments
2 322 € /m²
Reliability 7/10
Median price on the 34 transactions of the last 24 months.
from 1 700 to
3 381 € /m²
3 381 € /m²
60% of transactions from the 2nd to the 8th deciles.
Dwellings
3 653 € /m²
Reliability 9/10
Median price on the 25 transactions of the last 6 months.
from 2 277 to
4 466 € /m²
4 466 € /m²
60% of transactions from the 2nd to the 8th deciles.