emooki
HomePrice mapTransactions
🇬🇧 English🇫🇷 Français🇩🇪 Deutsch🇪🇸 Español🇮🇹 Italiano

Real estate price map


Real estate price map in the municipality of La Bastide-des-Jourdans, choose a section to see transactions by parcel.

Vaucluse (84)

La Bastide-des-Jourdans - Real estate price m²

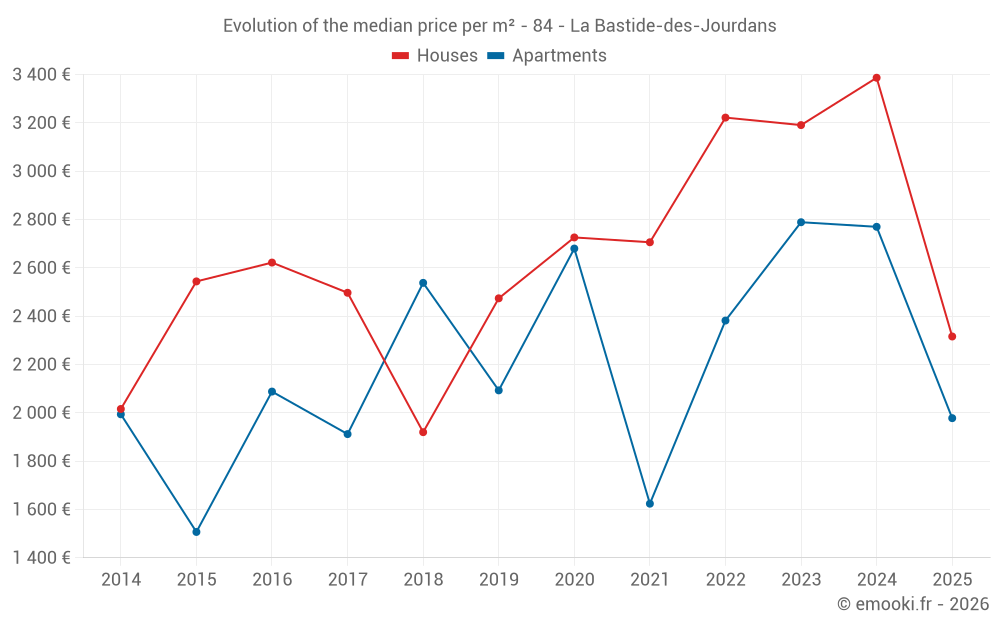
Median price of real estate
in the municipality of La Bastide-des-Jourdans

HousesHouses
3 146  /m²
1-23-45-67-89-10
Reliability 8/10
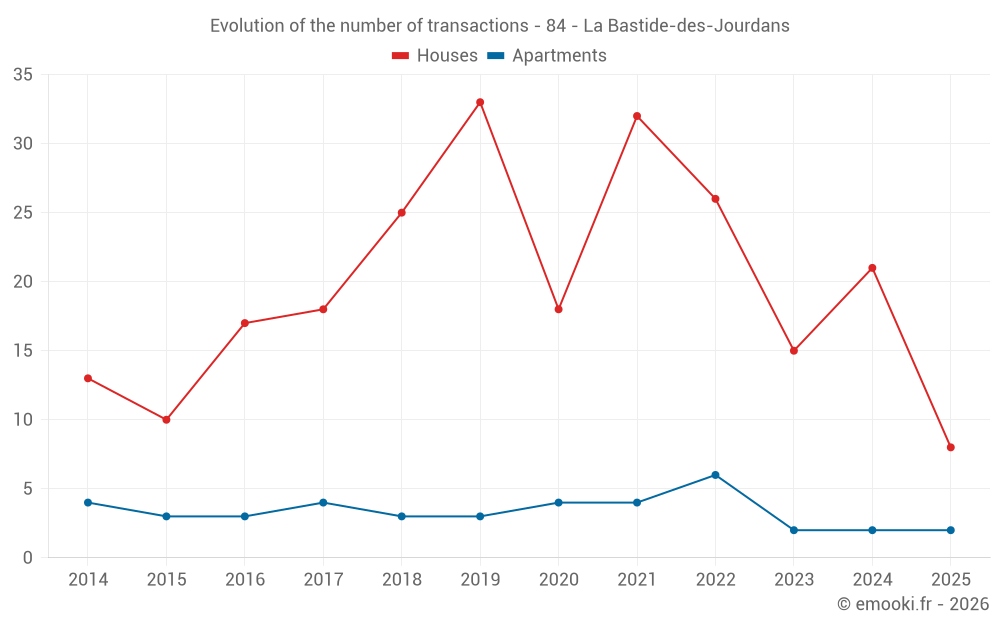
Median price on the 24 transactions of the last 12 months.
from 2 110 to
3 844  /m²
60% of transactions from the 2nd to the 8th deciles.
ApartmentsApartments
2 400  /m²
1-23-45-67-89-10
Reliability 5/10
Median price on the 13 transactions of the last 48 months.
from 2 192 to
3 103  /m²
60% of transactions from the 2nd to the 8th deciles.
DwellingsDwellings
2 936  /m²
1-23-45-67-89-10
Reliability 8/10
Median price on the 27 transactions of the last 12 months.
from 2 087 to
3 762  /m²
60% of transactions from the 2nd to the 8th deciles.
HousesEvolution of the price per m² of houses since...
1 year
-32%
2 years
-27%
3 years
-28%
4 years
-14%
5 years
-15%
6 years
-6.4%
7 years
+21%
8 years
-7.2%
9 years
-12%
10 years
-9%
11 years
+15%
The price per m² of houses has decreased by 32% since 1 year, but it has increased by 21% in 7 years.

Yearly evolution

Evolution of the median price per m²

Evolution of the median price per m² - 84 - La Bastide-des-Jourdans

Evolution of the number of transactions

Warning, last year incomplete. Projections made based on the proportions between semesters of the previous year at the departmental/national level and by type of property.

Evolution of the number of transactions - 84 - La Bastide-des-Jourdans

Yearly data

Descending order
Year
Houses
house
transactions
Houses
house
Price per m²
Apartments
apt.
transactions
Apartments
apt.
Price per m²
2025
8
2 316 
2
1 978 
2024
21
3 387 
2
2 770 
2023
15
3 191 
2
2 789 
2022
26
3 222 
6
2 382 
2021
32
2 706 
4
1 624 
2020
18
2 726 
4
2 680 
2019
33
2 474 
3
2 093 
2018
25
1 920 
3
2 538 
2017
18
2 497 
4
1 912 
2016
17
2 622 
3
2 088 
2015
10
2 544 
3
1 507 
2014
13
2 016 
4
1 994 

Analysis

Structure of prices per m²

Values of price percentiles per m² over the periods used for the estimated price of each type of property.

Structure of transaction amounts

Values of transaction amounts percentiles over the periods used for the estimated price of each type of property.

Transaction amounts and prices per m² by percentile

Ascending order
Percentile
Houses
house
Price per m²
Houses
house
Transaction amount
Apartments
apt.
Price per m²
Apartments
apt.
Transaction amount
10th percentile
1 688 
96 940 
2 159 
70 680 
20th percentile
2 110 
149 K
2 192 
95 400 
30th percentile
2 478 
240 K
2 252 
98 400 
40th percentile
2 739 
292 K
2 348 
145 K
50th percentile
3 146 
320 K
2 400 
171 K
60th percentile
3 405 
333 K
2 598 
174 K
70th percentile
3 644 
356 K
2 988 
180 K
80th percentile
3 844 
372 K
3 103 
197 K
90th percentile
4 192 
394 K
3 252 
230 K

National and departmental comparison

Evolution of the median price per m² of houses

Evolution of the median price per m² of apartments

Quarterly evolution

Evolution of the median price per m²

Evolution of the number of transactions

Quarterly data

Descending order
Quarter
Houses
house
transactions
Houses
house
Price per m²
Apartments
apt.
transactions
Apartments
apt.
Price per m²
2025 Q2
4
1 237 
1
1 020 
2025 Q1
4
3 146 
1
2 936 
2024 Q4
6
3 302 
0
--- 
2024 Q3
10
3 522 
1
2 203 
2024 Q2
3
1 842 
0
--- 
2024 Q1
2
1 773 
1
3 338 
2023 Q4
4
2 089 
0
--- 
2023 Q3
5
3 313 
1
2 513 
2023 Q2
3
1 896 
1
3 065 
2023 Q1
3
2 912 
0
--- 
2022 Q4
3
3 703 
0
--- 
2022 Q3
10
3 222 
5
2 400 
2022 Q2
5
2 333 
1
2 184 
2022 Q1
8
3 506 
0
--- 
2021 Q4
8
2 626 
0
--- 
2021 Q3
6
3 060 
1
2 153 
2021 Q2
10
2 412 
1
1 095 
2021 Q1
8
2 900 
2
1 940 
2020 Q4
3
1 736 
1
3 755 
2020 Q3
6
3 346 
1
2 727 
2020 Q2
6
2 726 
2
2 367 
2020 Q1
3
1 601 
0
--- 
2019 Q4
8
2 316 
0
--- 
2019 Q3
6
2 700 
1
2 373 
2019 Q2
10
2 524 
1
2 093 
2019 Q1
9
2 647 
1
2 000 
2018 Q4
13
2 348 
2
2 717 
2018 Q3
8
1 907 
1
2 538 
2018 Q2
4
1 653 
0
--- 
2017 Q4
6
2 088 
0
--- 
2017 Q3
4
3 698 
0
--- 
2017 Q2
6
2 497 
3
2 025 
2017 Q1
2
2 122 
1
945 
2016 Q4
5
2 615 
2
3 348 
2016 Q3
2
2 316 
1
1 227 
2016 Q2
4
2 602 
0
--- 
2016 Q1
6
2 978 
0
--- 
2015 Q4
3
2 349 
2
1 864 
2015 Q3
4
2 656 
1
741 
2015 Q2
2
2 137 
0
--- 
2015 Q1
1
3 096 
0
--- 
2014 Q4
2
1 743 
2
1 178 
2014 Q3
4
1 906 
0
--- 
2014 Q2
7
2 016 
2
1 994 

Overview of the latest real estate transactions

The following list is an anonymized overview of the latest transactions. For more details and to find all transactions, please use the map to view transactions by plot or the transaction search page for a search by criteria.

2025-06-11
277 554 
Sale
Land
17690 m2
-Terres
Land
80000 m2
-Bois
Land
13200 m2
-Terres
Land
9350 m2
-Terres
Land
15980 m2
-Bois
Land
8400 m2
-Terres
Land
27610 m2
-Vignes
Land
38340 m2
-Bois
Land
124770 m2
-Bois
Land
29530 m2
-Taillis simples
Land
76070 m2
-Bois
Land
10000 m2
-Vignes
Land
11380 m2
-Terres
Land
16880 m2
-Bois
Land
3990 m2
-Terres
Land
40 m2
-Eaux
/CANAL
Land
1810 m2
-Terres
Land
350 m2
-Bois
Land
3000 m2
-Terres
Land
440 m2
-Bois
Land
40 m2
-Eaux
/CANAL
Land
850 m2
-Jardins
Land
1490 m2
-Jardins
Land
1820 m2
-Bois
Land
7340 m2
-Bois
2025-05-15
153 500 
2 558  /m²(60 m²)
Sale
Houses
House
4 rooms
60 m2
Land
46 m2
-Sols
Land
40 m2
-Sols
2025-05-09
32 000 
Sale
Land
58 m2
-Sols
2025-04-29
75 900 
1 615  /m²(47 m²)
Sale
Houses
House
3 rooms
47 m2
Land
17 m2
-Sols
2025-04-28
100 000 
1 020  /m²(98 m²)
Sale
Apartments
Apartment
1 room
48 m2
Apartments
Apartment
3 rooms
50 m2
Land
49 m2
-Sols
2025-04-11
85 000 
607  /m²(140 m²)
Sale
Houses
House
5 rooms
140 m2
Land
60 m2
-Sols
1 outbuilding
2025-04-04
55 000 
859  /m²(64 m²)
Sale
Houses
House
3 rooms
64 m2
Land
412 m2
-Sols
2025-03-27
480 000 
3 582  /m²(134 m²)
Sale
Houses
House
4 rooms
134 m2
Land
9730 m2
-Bois
Land
380 m2
-Sols
Land
811 m2
-Terres
Land
19 m2
-Terres
Land
807 m2
-Bois
2025-03-13
98 000 
Sale
Land
451 m2
-Terrains à bâtir
2025-02-28
1 
Sale
Commercial property
Land
2730 m2
-Terres
Land
4445 m2
-Terres
Land
1180 m2
-Terres
Land
220 m2
-Eaux
Land
2956 m2
-Terres
Land
1410 m2
-Landes
Land
2040 m2
-Terres
Land
4375 m2
-Terres
Land
125 m2
-Eaux
2025-02-28
58 710 
2 936  /m²(20 m²)
Sale
Apartments
Apartment
1 room
20 m2
2025-02-19
170 000 
3 208  /m²(53 m²)
Sale
Houses
House
2 rooms
53 m2
Land
51 m2
-Sols
2025-02-10
162 000 
Sale
Land
92 m2
-Jardins
2025-01-31
370 000 
3 083  /m²(120 m²)
Sale
Houses
House
4 rooms
120 m2
Land
1035 m2
-Sols
Land
96 m2
-Sols
Land
451 m2
-Sols
2025-01-24
332 000 
2 075  /m²(160 m²)
Sale
Houses
House
5 rooms
160 m2
2 outbuildings
Land
422 m2
-Sols
Land
331 m2
-Sols
2024-12-27
13 000 
Sale
Land
813 m2
-Bois
Land
91732 m2
-Bois
Land
4784 m2
-Bois
2024-12-27
15 000 
1 500  /m²(10 m²)
Sale
Commercial property
10 m2
2024-12-16
124 800 
2 496  /m²(50 m²)
Sale
Houses
House
2 rooms
50 m2
1 outbuilding
Land
26 m2
-Sols
2024-11-28
1 
Sale
Land
418 m2
-Terres
2024-11-25
247 600 
2 134  /m²(116 m²)
Sale
Houses
House
3 rooms
110 m2
Land
121 m2
-Sols
1 outbuilding
Apartments
Apartment
1 room
6 m2
1 outbuilding
468 transactions listed in the municipality

Vaucluse (84)

Most expensive cities

City
name
Descending orderHouses
house
Price per m²
6 530 
5 858 
5 508 
5 477 
5 297 
5 055 
5 000 
4 793 
4 691 
City
name
Descending orderApartments
apt.
Price per m²
4 566 
4 536 
3 739 
3 696 
3 693 
3 580 
3 536 

Least expensive cities

City
name
Ascending orderHouses
house
Price per m²
1 333 
1 706 
1 790 
1 835 
2 000 
2 025 
2 066 
City
name
Ascending orderApartments
apt.
Price per m²
588 
1 000 
1 081 
1 136 
1 150 
1 226 
1 228 
1 230 
1 254