emooki
SearchPrice mapTransactions
🇬🇧 English🇫🇷 Français🇩🇪 Deutsch🇪🇸 Español🇮🇹 Italiano

Real estate price map


Real estate price map in the municipality of Apt.

Vaucluse (84)
Apt

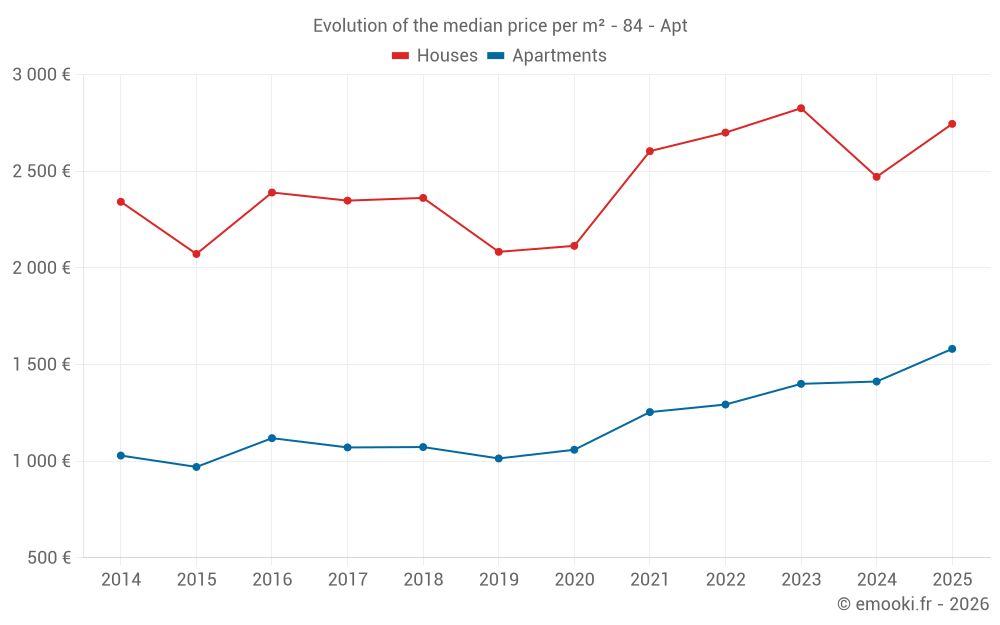
Median price of real estate
in the municipality of Apt

HousesHouses
2 745 € /m²
1-23-45-67-89-10
Reliability 9/10
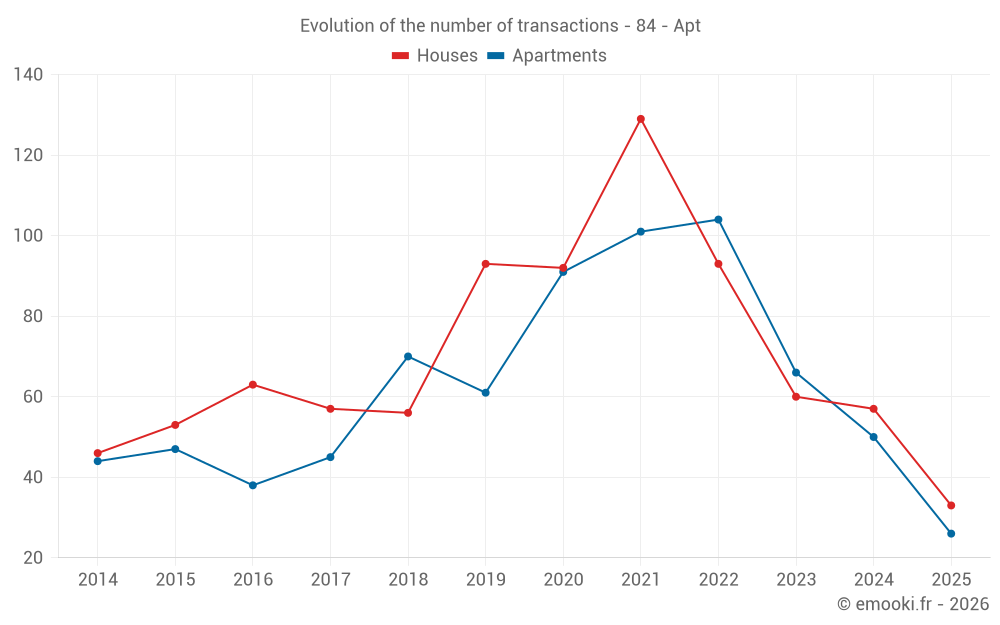
Median price on the 33 transactions of the last 6 months.
from 1 962 to
3 754 € /m²
60% of transactions from the 2nd to the 8th deciles.
ApartmentsApartments
1 581 € /m²
1-23-45-67-89-10
Reliability 9/10
Median price on the 26 transactions of the last 6 months.
from 1 189 to
2 250 € /m²
60% of transactions from the 2nd to the 8th deciles.
DwellingsDwellings
2 284 € /m²
1-23-45-67-89-10
Reliability 10/10
Median price on the 25 transactions of the last 3 months.
from 1 232 to
3 727 € /m²
60% of transactions from the 2nd to the 8th deciles.
HousesEvolution of the price per m² of houses
1 year
+11.1%
2 years
-2.9%
3 years
+1.7%
4 years
+5.4%
5 years
+29.8%
6 years
+31.8%
7 years
+16.2%
8 years
+16.9%
9 years
+14.9%
10 years
+32.5%
11 years
+17.2%
ApartmentsEvolution of the price per m² of apartments
1 year
+12%
2 years
+12.9%
3 years
+22.3%
4 years
+26.1%
5 years
+49.3%
6 years
+55.9%
7 years
+47.3%
8 years
+47.6%
9 years
+41.3%
10 years
+63%
11 years
+53.6%

Yearly evolution

Median price per m²

Number of transactions

Warning, last year incomplete. Projections made based on the proportions between semesters of the previous year at the departmental/national level and by type of property.

Yearly data

Descending order
Year
Houses
house
Price per m²
Houses
house
transactions
Apartments
apt.
Price per m²
Apartments
apt.
transactions
2025
2 745 €
33
1 581 €
26
2024
2 471 €
57
1 412 €
50
2023
2 826 €
60
1 400 €
66
2022
2 700 €
93
1 293 €
104
2021
2 604 €
129
1 254 €
101
2020
2 114 €
92
1 059 €
91
2019
2 083 €
93
1 014 €
61
2018
2 362 €
56
1 073 €
70
2017
2 348 €
57
1 071 €
45
2016
2 390 €
63
1 119 €
38
2015
2 072 €
53
970 €
47
2014
2 342 €
46
1 029 €
44

Quarterly evolution

Median price per m²

Number of transactions

Analysis

Structure of prices per m²

Values of price percentiles per m² over the periods used for the estimated price of each type of property.

Vaucluse (84)

Most expensive cities

City
name
Descending orderHouses
house
Price per m²
6 530 €
5 858 €
5 508 €
5 477 €
5 297 €
5 055 €
5 000 €
4 793 €
4 691 €
4 643 €
City
name
Descending orderApartments
apt.
Price per m²
17 038 €
4 566 €
4 536 €
3 739 €
3 696 €
3 693 €
3 595 €
3 587 €
3 580 €
3 536 €

Least expensive cities

City
name
Ascending orderHouses
house
Price per m²
1 333 €
1 464 €
1 706 €
1 790 €
1 835 €
1 904 €
2 000 €
2 025 €
2 066 €
2 099 €
City
name
Ascending orderApartments
apt.
Price per m²
588 €
1 000 €
1 009 €
1 081 €
1 136 €
1 150 €
1 226 €
1 228 €
1 230 €
1 254 €