emooki
HomePrice mapTransactions
🇬🇧 English🇫🇷 Français🇩🇪 Deutsch🇪🇸 Español🇮🇹 Italiano

Real estate price map


Real estate price map in the municipality of Albias, choose a section to see transactions by parcel.

Tarn-et-Garonne (82)

Albias - Real estate price m²

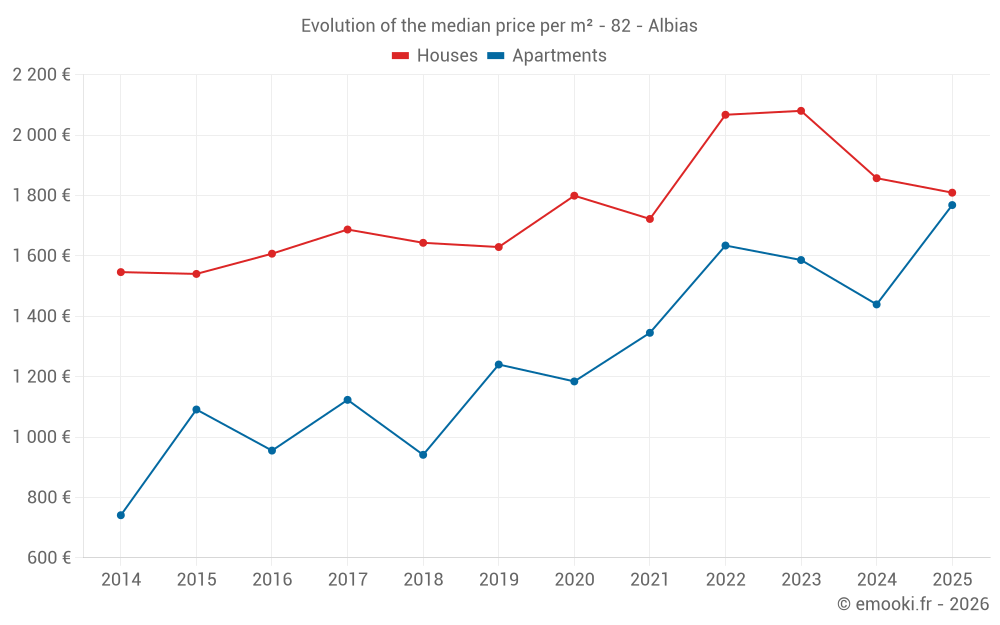
Median price of real estate
in the municipality of Albias

HousesHouses
1 788  /m²
1-23-45-67-89-10
Reliability 8/10
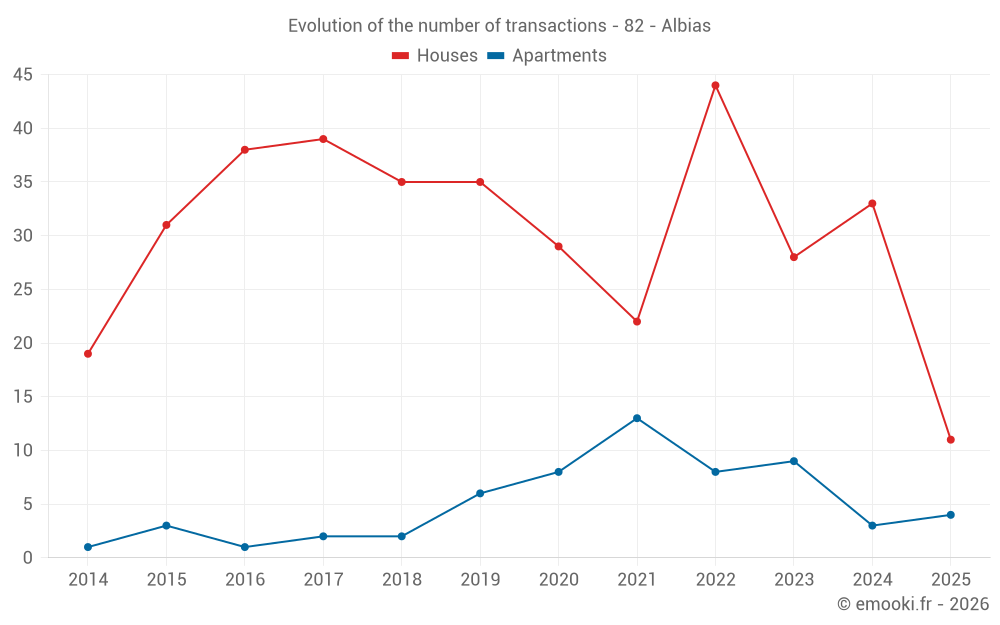
Median price on the 28 transactions of the last 12 months.
from 1 528 to
2 183  /m²
60% of transactions from the 2nd to the 8th deciles.
ApartmentsApartments
1 634  /m²
1-23-45-67-89-10
Reliability 6/10
Median price on the 18 transactions of the last 36 months.
from 1 414 to
1 745  /m²
60% of transactions from the 2nd to the 8th deciles.
DwellingsDwellings
1 769  /m²
1-23-45-67-89-10
Reliability 8/10
Median price on the 35 transactions of the last 12 months.
from 1 434 to
2 119  /m²
60% of transactions from the 2nd to the 8th deciles.
HousesEvolution of the price per m² of houses since...
1 year
-2.6%
2 years
-13%
3 years
-12%
4 years
+5.1%
5 years
+0.6%
6 years
+11%
7 years
+10%
8 years
+7.2%
9 years
+13%
10 years
+17%
11 years
+17%
The price per m² of houses has decreased by 13% since 2 years, but it has increased by 17% in 10 years.
ApartmentsEvolution of the price per m² of apartments since...
1 year
--
2 years
+11%
3 years
+8.2%
4 years
+31%
5 years
+49%
6 years
+43%
7 years
--
8 years
--
9 years
--
10 years
--
11 years
--

Yearly evolution

Evolution of the median price per m²

Evolution of the median price per m² - 82 - Albias

Evolution of the number of transactions

Warning, last year incomplete. Projections made based on the proportions between semesters of the previous year at the departmental/national level and by type of property.

Evolution of the number of transactions - 82 - Albias

Yearly data

Descending order
Year
Houses
house
transactions
Houses
house
Price per m²
Apartments
apt.
transactions
Apartments
apt.
Price per m²
2025
11
1 809 
4
1 768 
2024
33
1 857 
3
1 439 
2023
28
2 080 
9
1 586 
2022
44
2 067 
8
1 634 
2021
22
1 722 
13
1 345 
2020
29
1 799 
8
1 184 
2019
35
1 629 
6
1 240 
2018
35
1 643 
2
941 
2017
39
1 687 
2
1 123 
2016
38
1 607 
1
955 
2015
31
1 540 
3
1 091 
2014
19
1 546 
1
741 

Analysis

Structure of prices per m²

Values of price percentiles per m² over the periods used for the estimated price of each type of property.

Structure of transaction amounts

Values of transaction amounts percentiles over the periods used for the estimated price of each type of property.

Transaction amounts and prices per m² by percentile

Ascending order
Percentile
Houses
house
Price per m²
Houses
house
Transaction amount
Apartments
apt.
Price per m²
Apartments
apt.
Transaction amount
10th percentile
1 249 
117 K
1 359 
62 400 
20th percentile
1 528 
153 K
1 414 
63 800 
30th percentile
1 631 
170 K
1 450 
66 000 
40th percentile
1 719 
174 K
1 579 
73 200 
50th percentile
1 788 
189 K
1 634 
75 500 
60th percentile
1 918 
208 K
1 653 
83 600 
70th percentile
2 104 
212 K
1 706 
91 800 
80th percentile
2 183 
223 K
1 745 
93 800 
90th percentile
2 372 
239 K
1 810 
113 K

National and departmental comparison

Evolution of the median price per m² of houses

Evolution of the median price per m² of apartments

Quarterly evolution

Evolution of the median price per m²

Evolution of the number of transactions

Quarterly data

Descending order
Quarter
Houses
house
transactions
Houses
house
Price per m²
Apartments
apt.
transactions
Apartments
apt.
Price per m²
2025 Q2
7
1 786 
3
1 750 
2025 Q1
4
2 138 
1
1 786 
2024 Q4
9
1 890 
0
--- 
2024 Q3
8
1 708 
3
1 439 
2024 Q2
7
1 808 
0
--- 
2024 Q1
9
2 145 
0
--- 
2023 Q4
5
1 875 
2
1 605 
2023 Q3
9
1 813 
1
1 347 
2023 Q2
9
2 317 
5
1 586 
2023 Q1
5
2 373 
1
1 652 
2022 Q4
10
2 100 
2
1 688 
2022 Q3
14
2 101 
0
--- 
2022 Q2
7
1 848 
2
1 644 
2022 Q1
13
2 083 
4
1 516 
2021 Q4
4
1 580 
0
--- 
2021 Q3
4
2 027 
3
1 527 
2021 Q2
9
1 637 
6
1 339 
2021 Q1
5
1 705 
4
1 341 
2020 Q4
13
1 833 
3
1 164 
2020 Q3
6
1 946 
3
1 316 
2020 Q2
5
1 337 
0
--- 
2020 Q1
5
1 475 
2
214 
2019 Q4
11
1 765 
1
1 946 
2019 Q3
12
1 770 
1
1 207 
2019 Q2
7
1 543 
3
1 273 
2019 Q1
5
1 629 
1
877 
2018 Q4
11
1 692 
0
--- 
2018 Q3
12
1 862 
0
--- 
2018 Q2
6
1 638 
1
805 
2018 Q1
6
1 526 
1
1 077 
2017 Q4
8
1 776 
0
--- 
2017 Q3
9
1 514 
1
708 
2017 Q2
15
1 700 
0
--- 
2017 Q1
7
1 379 
1
1 538 
2016 Q4
12
1 708 
1
955 
2016 Q3
8
1 302 
0
--- 
2016 Q2
5
1 547 
0
--- 
2016 Q1
13
1 643 
0
--- 
2015 Q4
9
1 512 
1
1 091 
2015 Q3
8
1 656 
1
780 
2015 Q2
10
1 458 
1
1 214 
2015 Q1
4
1 688 
0
--- 
2014 Q4
6
1 742 
0
--- 
2014 Q3
2
1 396 
0
--- 
2014 Q2
8
1 503 
0
--- 
2014 Q1
3
1 176 
1
741 

Overview of the latest real estate transactions

The following list is an anonymized overview of the latest transactions. For more details and to find all transactions, please use the map to view transactions by plot or the transaction search page for a search by criteria.

2025-06-13
170 000 
1 809  /m²(94 m²)
Sale
Houses
House
5 rooms
94 m2
Land
913 m2
-Jardins
/Jardin potager
Land
1000 m2
-Sols
Land
416 m2
-Terres
2025-06-05
16 500 
Sale
Land
7433 m2
-Terres
Land
3540 m2
-Terres
Land
7180 m2
-Terres
2025-05-28
212 000 
2 356  /m²(90 m²)
Sale
Houses
House
4 rooms
90 m2
1 outbuilding
Land
592 m2
-Sols
Land
1468 m2
-Jardins
/Jardin potager
2025-05-26
80 000 
1 250  /m²(64 m²)
Sale
Houses
House
3 rooms
64 m2
Land
325 m2
-Sols
2025-05-26
112 000 
1 867  /m²(60 m²)
Sale
Apartments
Apartment
3 rooms
60 m2
2025-05-13
63 000 
1 750  /m²(36 m²)
Sale
Apartments
Apartment
2 rooms
36 m2
1 outbuilding
2025-05-07
155 607 
Sale
Land
56691 m2
-Terres
Land
5385 m2
-Peupleraies
Land
56692 m2
-Terres
Land
5 m2
-Prés
Land
599 m2
-Terres
Land
326 m2
-Prés
2025-05-05
92 000 
1 415  /m²(65 m²)
Sale
Apartments
Apartment
3 rooms
65 m2
2 outbuildings
2025-04-28
3 591 
Sale
Land
5985 m2
-Terres
2025-04-23
347 000 
2 410  /m²(144 m²)
Sale
Houses
House
5 rooms
144 m2
Land
500 m2
-Terrains d'agrément
Land
1068 m2
-Sols
2025-04-18
150 000 
1 786  /m²(84 m²)
Sale
Houses
House
5 rooms
84 m2
Land
499 m2
-Sols
2025-04-15
245 000 
1 075  /m²(228 m²)
Sale
Houses
House
7 rooms
228 m2
2 outbuildings
Land
9136 m2
-Taillis simples
Land
1000 m2
-Sols
2025-04-04
210 000 
1 522  /m²(138 m²)
Sale
Houses
House
4 rooms
138 m2
2 outbuildings
Land
745 m2
-Sols
Land
142 m2
-Sols
2025-03-31
130 000 
2 031  /m²(64 m²)
Sale
Houses
House
3 rooms
64 m2
Land
528 m2
-Sols
2025-03-28
110 000 
973  /m²(113 m²)
Sale
Houses
House
6 rooms
113 m2
Land
1003 m2
-Terres
Land
1000 m2
-Sols
2025-03-25
18 000 
Sale
Land
6079 m2
-Terres
2025-02-18
300 
Exchange
Land
72 m2
-Terres
2025-02-11
6 000 
Sale
Land
202 m2
-Sols
Land
904 m2
-Terres
Land
16 m2
-Sols
2025-02-07
116 090 
1 786  /m²(65 m²)
Sale
Apartments
Apartment
3 rooms
65 m2
2 outbuildings
2025-01-28
247 000 
2 245  /m²(110 m²)
Sale
Houses
House
4 rooms
110 m2
Land
2020 m2
-Sols
Land
1659 m2
-Terres
Land
2534 m2
-Terres
694 transactions listed in the municipality

Tarn-et-Garonne (82)

Most expensive cities

City
name
Descending orderHouses
house
Price per m²
2 797 
2 620 
2 616 
2 419 
2 352 
2 333 
2 294 
2 289 
2 288 
2 264 
City
name
Descending orderApartments
apt.
Price per m²
6 095 
2 392 
2 387 
2 084 
1 892 
1 819 
1 803 

Least expensive cities

City
name
Ascending orderHouses
house
Price per m²
641 
844 
850 
944 
968 
1 052 
1 068 
City
name
Ascending orderApartments
apt.
Price per m²
108 
116 
156 
174 
288 
333 
381 
397 
455