emooki
HomePrice mapTransactions
🇬🇧 English🇫🇷 Français🇩🇪 Deutsch🇪🇸 Español🇮🇹 Italiano

Real estate price map


Real estate price map in the municipality of Wiencourt-l'Équipée, choose a section to see transactions by parcel.

Somme (80)
Wiencourt-l'Équipée

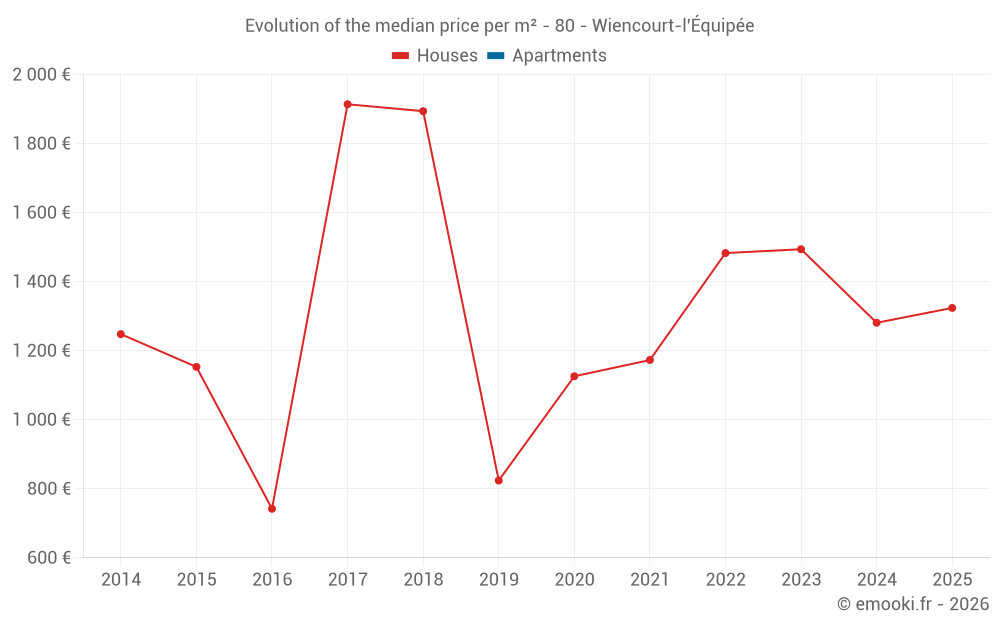
Median price of real estate
in the municipality of Wiencourt-l'Équipée

HousesHouses
1 281  /m²
1-23-45-67-89-10
Reliability 5/10
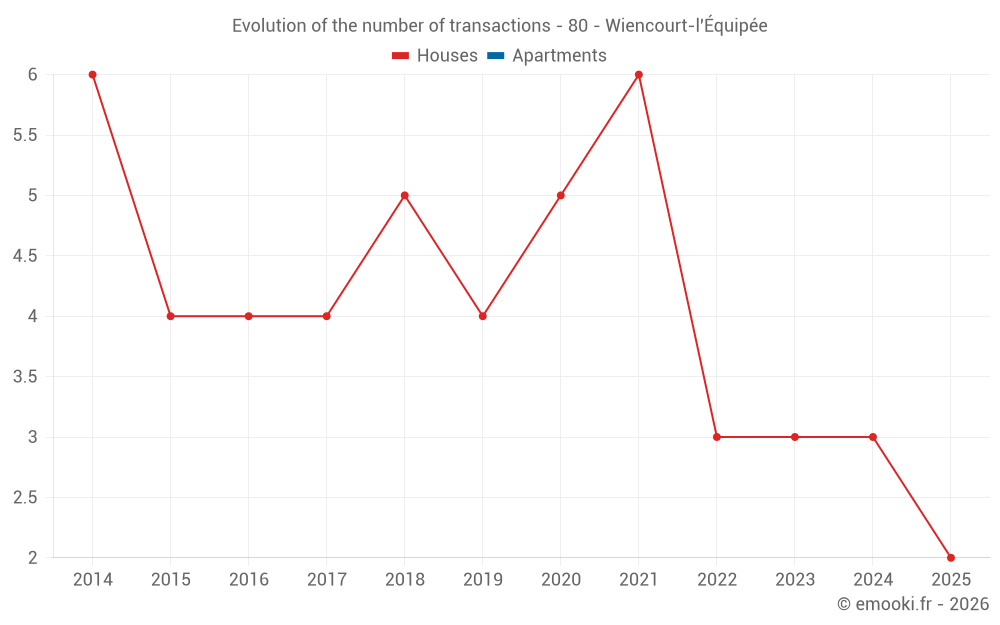
Median price on the 13 transactions of the last 48 months.
from 1 200 to
1 490  /m²
60% of transactions from the 2nd to the 8th deciles.

Yearly evolution

Evolution of the median price per m²

Evolution of the number of transactions

Warning, last year incomplete. Projections made based on the proportions between semesters of the previous year at the departmental/national level and by type of property.

Yearly data

Descending order
Year
Houses
house
transactions
Houses
house
Price per m²
Apartments
apt.
transactions
Apartments
apt.
Price per m²
2025
2
1 324 
0
--- 
2024
3
1 281 
0
--- 
2023
3
1 494 
0
--- 
2022
3
1 483 
0
--- 
2021
6
1 173 
0
--- 
2020
5
1 126 
0
--- 
2019
4
824 
0
--- 
2018
5
1 894 
0
--- 
2017
4
1 914 
0
--- 
2016
4
742 
0
--- 
2015
4
1 153 
0
--- 
2014
6
1 248 
0
--- 

Analysis

Structure of prices per m²

Values of price percentiles per m² over the periods used for the estimated price of each type of property.

Structure of transaction amounts

Values of transaction amounts percentiles over the periods used for the estimated price of each type of property.

Transaction amounts and prices per m² by percentile

Ascending order
Percentile
Houses
house
Price per m²
Houses
house
Transaction amount
Apartments
apt.
Price per m²
Apartments
apt.
Transaction amount
10th percentile
1 103 
77 000 
--- 
--- 
20th percentile
1 200 
85 600 
--- 
--- 
30th percentile
1 227 
107 K
--- 
--- 
40th percentile
1 259 
129 K
--- 
--- 
50th percentile
1 281 
133 K
--- 
--- 
60th percentile
1 360 
149 K
--- 
--- 
70th percentile
1 453 
164 K
--- 
--- 
80th percentile
1 490 
173 K
--- 
--- 
90th percentile
1 797 
203 K
--- 
--- 

National and departmental comparison

Evolution of the median price per m² of houses

Evolution of the median price per m² of apartments

Quarterly evolution

Evolution of the median price per m²

Evolution of the number of transactions

Quarterly data

Descending order
Quarter
Houses
house
transactions
Houses
house
Price per m²
Apartments
apt.
transactions
Apartments
apt.
Price per m²
2025 Q2
1
1 433 
0
--- 
2025 Q1
1
1 214 
0
--- 
2024 Q4
2
1 312 
0
--- 
2024 Q1
1
1 190 
0
--- 
2023 Q3
2
1 554 
0
--- 
2023 Q1
1
1 494 
0
--- 
2022 Q4
1
2 086 
0
--- 
2022 Q3
1
1 483 
0
--- 
2022 Q1
1
192 
0
--- 
2021 Q4
2
1 173 
0
--- 
2021 Q2
1
192 
0
--- 
2021 Q1
3
2 059 
0
--- 
2020 Q4
2
1 342 
0
--- 
2020 Q2
2
1 166 
0
--- 
2020 Q1
1
1 089 
0
--- 
2019 Q3
3
1 044 
0
--- 
2019 Q1
1
302 
0
--- 
2018 Q4
1
3 177 
0
--- 
2018 Q3
1
1 894 
0
--- 
2018 Q2
1
1 960 
0
--- 
2018 Q1
2
1 314 
0
--- 
2017 Q3
2
1 914 
0
--- 
2017 Q1
2
2 088 
0
--- 
2016 Q3
2
1 676 
0
--- 
2016 Q2
2
594 
0
--- 
2015 Q4
1
494 
0
--- 
2015 Q3
1
917 
0
--- 
2015 Q1
2
1 694 
0
--- 
2014 Q3
2
918 
0
--- 
2014 Q2
2
1 221 
0
--- 
2014 Q1
2
1 955 
0
--- 

Overview of the latest real estate transactions

The following list is an anonymized overview of the latest transactions. For more details and to find all transactions, please use the map to view transactions by plot or the transaction search page for a search by criteria.

2025-04-29
11 015 
Sale
Commercial property
Land
2800 m2
-Sols
Commercial property
Land
4256 m2
-Sols
Land
8680 m2
-Terres
2025-04-28
14 400 
Sale
Land
8154 m2
-Terres
Land
8154 m2
-Terres
Land
7692 m2
-Terres
2025-04-28
8 772 
Sale
Commercial property
Land
2720 m2
-Sols
Commercial property
Land
1132 m2
-Sols
Land
8680 m2
-Terres
2025-04-03
146 200 
1 433  /m²(102 m²)
Sale
Houses
House
3 rooms
102 m2
2 outbuildings
Land
353 m2
-Sols
Land
1330 m2
-Jardins
2025-01-31
85 000 
1 214  /m²(70 m²)
Sale
Houses
House
3 rooms
70 m2
Land
97 m2
-Sols
2024-12-26
161 000 
1 342  /m²(120 m²)
Sale
Houses
House
5 rooms
120 m2
1 outbuilding
Land
559 m2
-Sols
2024-12-12
130 700 
1 281  /m²(102 m²)
Sale
Houses
House
3 rooms
102 m2
2 outbuildings
Land
353 m2
-Sols
Land
1330 m2
-Jardins
2024-08-07
24 
Sale
Land
8 m2
-Sols
2024-03-09
38 000 
Sale
1 outbuilding
Land
4895 m2
-Eaux
2024-02-21
75 000 
1 190  /m²(63 m²)
Sale
Houses
House
4 rooms
63 m2
5 outbuildings
Land
331 m2
-Sols
Land
605 m2
-Jardins
Land
18 m2
-Sols
2024-02-19
14 400 
Exchange
Land
24000 m2
-Terres
Land
24000 m2
-Terres
2023-07-11
209 800 
1 873  /m²(112 m²)
Sale
Houses
House
4 rooms
112 m2
1 outbuilding
Land
1098 m2
-Sols
Land
823 m2
-Jardins
2023-07-06
86 500 
1 236  /m²(70 m²)
Sale
Houses
House
3 rooms
70 m2
Land
97 m2
-Sols
2023-02-21
133 000 
1 494  /m²(89 m²)
Sale
Land
177 m2
-Sols
Houses
House
5 rooms
89 m2
Land
729 m2
-Sols
Land
324 m2
-Jardins
2023-01-24
300 
Sale
Land
284 m2
-Terres
2022-11-04
169 000 
2 086  /m²(81 m²)
Sale
Houses
House
3 rooms
81 m2
1 outbuilding
Land
698 m2
-Sols
Land
1181 m2
-Jardins
Land
7 m2
-Sols
2022-08-05
175 000 
1 483  /m²(118 m²)
Sale
Houses
House
5 rooms
118 m2
1 outbuilding
Land
824 m2
-Sols
2022-05-23
5 000 
Sale
Land
297 m2
-Landes
Land
3000 m2
-Terrains à bâtir
2022-02-25
30 000 
192  /m²(156 m²)
Sale
Houses
House
3 rooms
78 m2
Houses
House
3 rooms
78 m2
Land
856 m2
-Sols
2021-11-30
120 000 
1 081  /m²(111 m²)
Sale
Houses
House
5 rooms
111 m2
Land
922 m2
-Sols
Land
377 m2
-Terres
Land
110 m2
-Terres
75 transactions listed in the municipality

Somme (80)

Most expensive cities

City
name
Descending orderHouses
house
Price per m²
3 742 
3 474 
3 280 
3 012 
2 989 
2 986 
2 600 
2 529 
City
name
Descending orderApartments
apt.
Price per m²
8 100 
5 334 
4 178 
3 964 
3 905 
3 582 
3 144 
2 768 
2 635 

Least expensive cities

City
name
Ascending orderHouses
house
Price per m²
486 
500 
598 
625 
663 
673 
693 
City
name
Ascending orderApartments
apt.
Price per m²
161 
273 
331 
366 
428