Real estate price map
Real estate price map in the municipality of Méricourt-l'Abbé, choose a section to see transactions by parcel.
Somme (80)
Price per m² in Méricourt-l'Abbé
Median price of real estate
in the municipality of Méricourt-l'Abbé
Houses
1 468 € /m²
Reliability 6/10
Median price on the 24 transactions of the last 36 months.
from 1 063 to
1 828 € /m²
1 828 € /m²
60% of transactions from the 2nd to the 8th deciles.
Yearly evolution
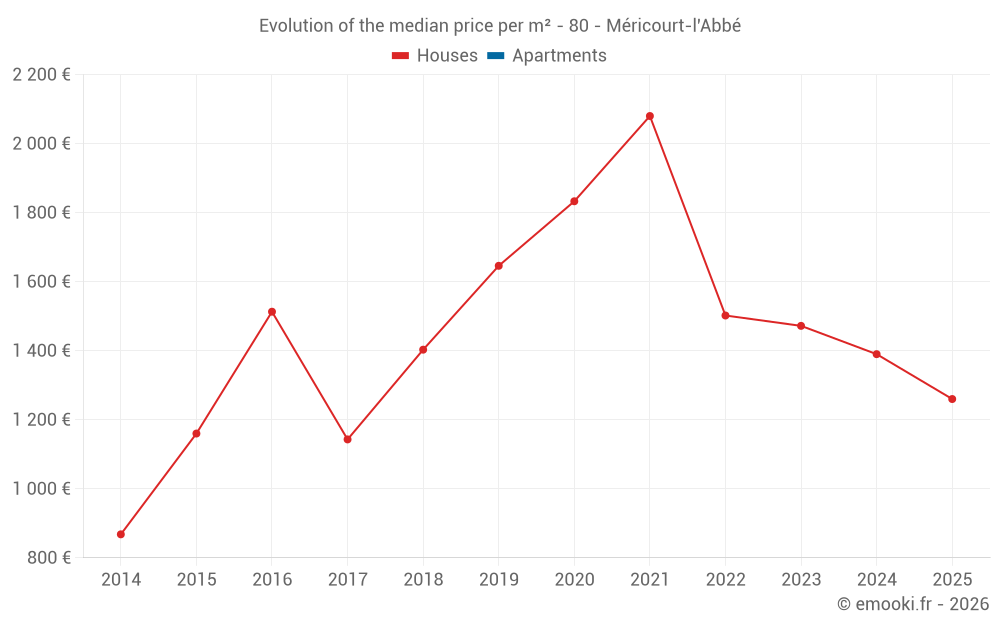
Evolution of the median price per m²
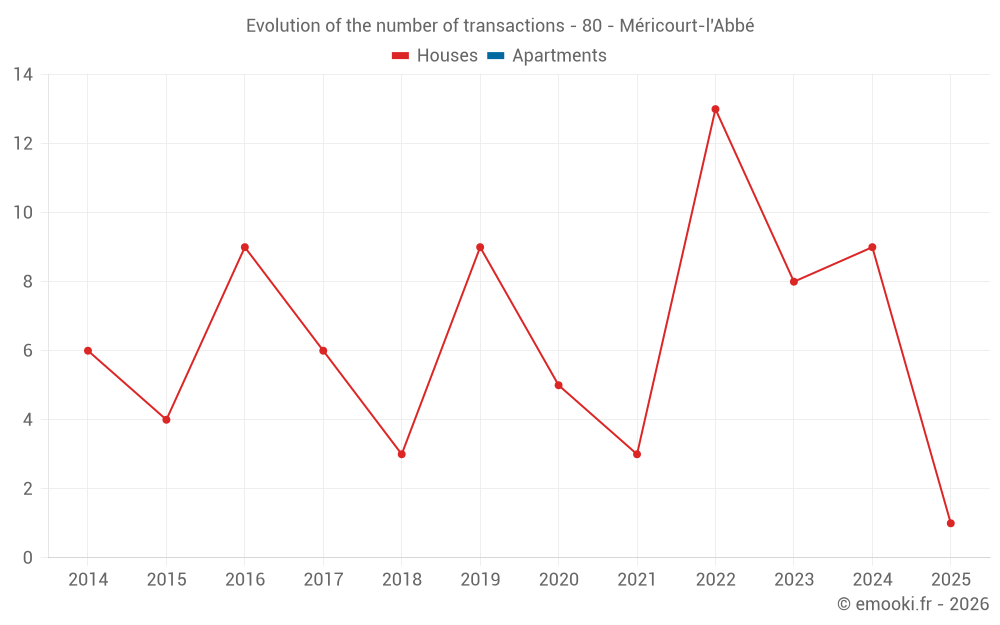
Evolution of the number of transactions
Warning, last year incomplete. Projections made based on the proportions between semesters of the previous year at the departmental/national level and by type of property.
Yearly data
Year
house
transactions
transactions
house
Price per m²
Price per m²
apt.
transactions
transactions
apt.
Price per m²
Price per m²
2025
1
1 260 €
0
--- €
2024
9
1 390 €
0
--- €
2023
8
1 472 €
0
--- €
2022
13
1 502 €
0
--- €
2021
3
2 080 €
0
--- €
2020
5
1 833 €
0
--- €
2019
9
1 646 €
0
--- €
2018
3
1 403 €
0
--- €
2017
6
1 143 €
0
--- €
2016
9
1 513 €
0
--- €
2015
4
1 160 €
0
--- €
2014
6
868 €
0
--- €
Analysis
Structure of prices per m²
Values of price percentiles per m² over the periods used for the estimated price of each type of property.
Structure of transaction amounts
Values of transaction amounts percentiles over the periods used for the estimated price of each type of property.
Transaction amounts and prices per m² by percentile
Percentile
house
Price per m²
Price per m²
house
Transaction amount
Transaction amount
apt.
Price per m²
Price per m²
apt.
Transaction amount
Transaction amount
10th percentile
572 €
66 500 €
--- €
--- €
20th percentile
1 063 €
99 200 €
--- €
--- €
30th percentile
1 305 €
125 K€
--- €
--- €
40th percentile
1 394 €
153 K€
--- €
--- €
50th percentile
1 468 €
181 K€
--- €
--- €
60th percentile
1 544 €
212 K€
--- €
--- €
70th percentile
1 722 €
215 K€
--- €
--- €
80th percentile
1 828 €
237 K€
--- €
--- €
90th percentile
2 186 €
274 K€
--- €
--- €
National and departmental comparison
Evolution of the median price per m² of houses
Evolution of the median price per m² of apartments
Quarterly evolution
Evolution of the median price per m²
Evolution of the number of transactions
Quarterly data
Quarter
house
transactions
transactions
house
Price per m²
Price per m²
apt.
transactions
transactions
apt.
Price per m²
Price per m²
2025 Q1
1
1 260 €
0
--- €
2024 Q4
4
1 714 €
0
--- €
2024 Q3
1
1 385 €
0
--- €
2024 Q2
2
874 €
0
--- €
2024 Q1
2
1 790 €
0
--- €
2023 Q4
1
1 806 €
0
--- €
2023 Q3
1
1 546 €
0
--- €
2023 Q2
2
1 462 €
0
--- €
2023 Q1
4
1 212 €
0
--- €
2022 Q4
5
1 502 €
0
--- €
2022 Q3
1
1 738 €
0
--- €
2022 Q2
3
1 283 €
0
--- €
2022 Q1
4
1 376 €
0
--- €
2021 Q4
1
2 080 €
0
--- €
2021 Q3
1
2 110 €
0
--- €
2021 Q2
1
1 690 €
0
--- €
2020 Q4
1
1 964 €
0
--- €
2020 Q3
1
2 253 €
0
--- €
2020 Q2
1
1 261 €
0
--- €
2020 Q1
2
1 466 €
0
--- €
2019 Q4
2
3 964 €
0
--- €
2019 Q3
5
1 549 €
0
--- €
2019 Q2
1
2 673 €
0
--- €
2019 Q1
1
1 529 €
0
--- €
2018 Q4
2
1 484 €
0
--- €
2018 Q2
1
1 333 €
0
--- €
2017 Q4
2
1 296 €
0
--- €
2017 Q3
1
1 569 €
0
--- €
2017 Q2
2
1 002 €
0
--- €
2017 Q1
1
960 €
0
--- €
2016 Q4
3
1 381 €
0
--- €
2016 Q3
2
1 758 €
0
--- €
2016 Q2
3
2 287 €
0
--- €
2016 Q1
1
1 513 €
0
--- €
2015 Q3
1
1 250 €
0
--- €
2015 Q2
2
1 564 €
0
--- €
2015 Q1
1
750 €
0
--- €
2014 Q4
1
722 €
0
--- €
2014 Q3
2
887 €
0
--- €
2014 Q2
1
625 €
0
--- €
2014 Q1
2
1 081 €
0
--- €
Overview of the latest real estate transactions
The following list is an anonymized overview of the latest transactions. For more details and to find all transactions, please use the map to view transactions by plot or the transaction search page for a search by criteria.
2025-02-27
126 000 €1 260 € /m²(100 m²)
Sale
House
4 rooms
100 m2
Land
723 m2
-Sols
2024-11-27
179 800 €2 335 € /m²(77 m²)
Sale
House
4 rooms
77 m2
Land
715 m2
-Sols
2024-11-14
40 000 €500 € /m²(80 m²)
Sale
House
2 rooms
80 m2
1 outbuilding
Land
663 m2
-Sols
Land
600 m2
-Jardins
2024-11-13
2 350 €Sale
Land
1660 m2
-Terres
2024-11-08
70 000 €1 094 € /m²(64 m²)
Sale
House
3 rooms
64 m2
2 outbuildings
Land
294 m2
-Sols
2024-10-23
288 000 €2 880 € /m²(100 m²)
Sale
House
3 rooms
100 m2
2 outbuildings
Land
410 m2
-Sols
Land
287 m2
-Jardins
Land
564 m2
-Sols
Land
49 m2
-Jardins
2024-08-29
2 500 €Sale
Land
2040 m2
-Terres
2024-08-09
181 500 €1 385 € /m²(131 m²)
Sale
House
6 rooms
131 m2
2 outbuildings
Land
470 m2
-Sols
2024-08-06
42 000 €Sale
Land
487 m2
-Jardins
2024-07-23
183 871 €Sale
Land
74080 m2
-Terres
Land
1600 m2
-Taillis simples
Land
2 m2
-Terres
Land
1986 m2
-Terres
Land
3640 m2
-Terres
Land
1820 m2
-Terres
Land
86470 m2
-Terres
Land
2360 m2
-Taillis simples
Land
19200 m2
-Terres
Land
6400 m2
-Terres
2024-07-23
188 923 €Sale
Land
60084 m2
-Terres
Land
79600 m2
-Terres
Land
560 m2
-Landes
Land
370 m2
-Landes
Land
12000 m2
-Terres
2024-07-23
148 011 €Sale
Land
8590 m2
-Terres
Land
37602 m2
-Terres
Land
1425 m2
-Taillis simples
Land
21956 m2
-Terres
Land
1110 m2
-Taillis simples
Land
32934 m2
-Terres
Land
9080 m2
-Terres
Land
2525 m2
-Terres
Land
30692 m2
-Terres
2024-06-03
162 619 €1 390 € /m²(117 m²)
Sale
House
5 rooms
117 m2
Land
272 m2
-Sols
2024-04-30
60 000 €357 € /m²(168 m²)
Sale
House
7 rooms
168 m2
4 outbuildings
Land
3058 m2
-Sols
Land
2188 m2
-Prés
Land
8410 m2
-Prés
2024-03-29
215 000 €1 720 € /m²(125 m²)
Sale
House
5 rooms
125 m2
1 outbuilding
Land
900 m2
-Sols
2024-02-16
212 000 €1 860 € /m²(114 m²)
Sale
House
5 rooms
114 m2
1 outbuilding
Land
900 m2
-Sols
2023-12-01
112 000 €1 806 € /m²(62 m²)
Sale
House
3 rooms
62 m2
4 outbuildings
Land
508 m2
-Sols
Land
1798 m2
-Jardins
Land
572 m2
-Sols
Land
2612 m2
-Jardins
2023-09-20
37 000 €148 € /m²(250 m²)
Sale
Commercial property
250 m2
Land
329 m2
-Sols
2023-09-11
150 000 €1 546 € /m²(97 m²)
Sale
House
4 rooms
97 m2
Land
507 m2
-Sols
Land
2035 m2
-Jardins
2023-06-21
1 000 €Sale
Land
1600 m2
-Peupleraies
127 transactions listed in the municipality
Compare with neighboring municipalities
City
name
name
house
Price per m²
Price per m²
apt.
Price per m²
Price per m²
City information
Zip code
- 80800 MERICOURT L ABBE
Data source & update
- Latest publication of the property value request (DVF) database made available by the DGFiP on October 19, 2025, covering transactions up to 06/30/2025:
- Administrative/cadastral division as of September 1, 2025, and municipal movements as of January 1, 2025: