emooki
HomePrice mapTransactions
🇬🇧 English🇫🇷 Français🇩🇪 Deutsch🇪🇸 Español🇮🇹 Italiano

Real estate price map


Real estate price map in the municipality of Longpré-les-Corps-Saints, choose a section to see transactions by parcel.

Somme (80)
Longpré-les-Corps-Saints

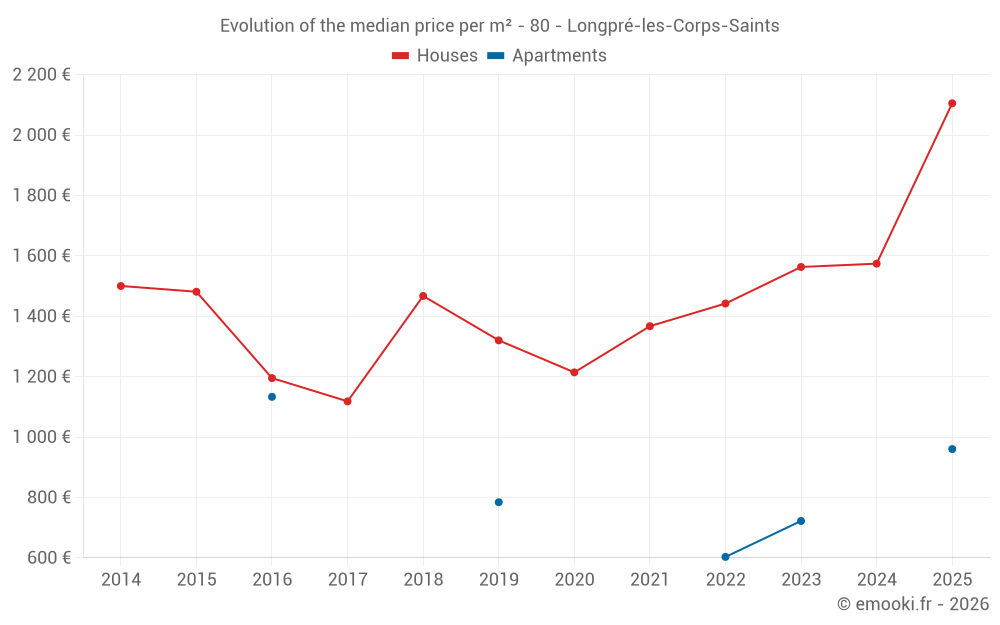
Median price of real estate
in the municipality of Longpré-les-Corps-Saints

HousesHouses
1 410  /m²
1-23-45-67-89-10
Reliability 8/10
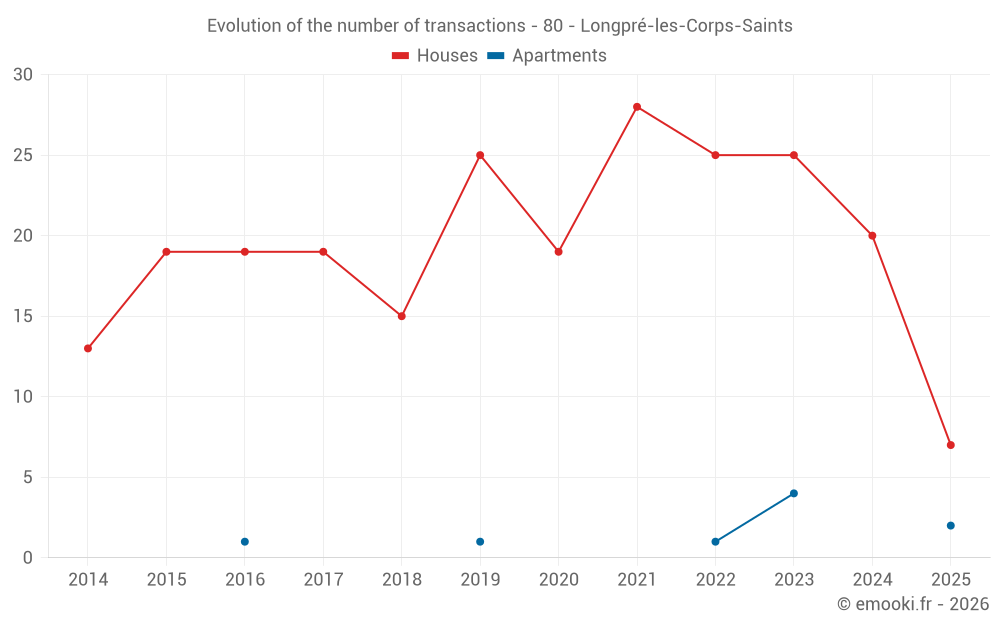
Median price on the 16 transactions of the last 12 months.
from 746 to
2 143  /m²
60% of transactions from the 2nd to the 8th deciles.
ApartmentsApartments
772  /m²
1-23-45-67-89-10
Reliability 3/10
Median price on the 8 transactions of the last 72 months.
DwellingsDwellings
1 338  /m²
1-23-45-67-89-10
Reliability 8/10
Median price on the 18 transactions of the last 12 months.
from 798 to
2 128  /m²
60% of transactions from the 2nd to the 8th deciles.
HousesEvolution of the price per m² of houses since...
1 year
+34%
2 years
+35%
3 years
+46%
4 years
+54%
5 years
+73%
6 years
+59%
7 years
+43%
8 years
+88%
9 years
+76%
10 years
+42%
11 years
+40%

Yearly evolution

Evolution of the median price per m²

Evolution of the number of transactions

Warning, last year incomplete. Projections made based on the proportions between semesters of the previous year at the departmental/national level and by type of property.

Yearly data

Descending order
Year
Houses
house
transactions
Houses
house
Price per m²
Apartments
apt.
transactions
Apartments
apt.
Price per m²
2025
7
2 105 
2
960 
2024
20
1 574 
0
--- 
2023
25
1 563 
4
722 
2022
25
1 442 
1
603 
2021
28
1 367 
0
--- 
2020
19
1 214 
0
--- 
2019
25
1 320 
1
784 
2018
15
1 467 
0
--- 
2017
19
1 118 
0
--- 
2016
19
1 195 
1
1 133 
2015
19
1 481 
0
--- 
2014
13
1 500 
0
--- 

Analysis

Structure of prices per m²

Values of price percentiles per m² over the periods used for the estimated price of each type of property.

Structure of transaction amounts

Values of transaction amounts percentiles over the periods used for the estimated price of each type of property.

Transaction amounts and prices per m² by percentile

Ascending order
Percentile
Houses
house
Price per m²
Houses
house
Transaction amount
Apartments
apt.
Price per m²
Apartments
apt.
Transaction amount
10th percentile
616 
46 500 
491 
68 250 
20th percentile
746 
50 000 
635 
85 200 
30th percentile
1 225 
69 500 
690 
102 K
40th percentile
1 328 
85 000 
745 
116 K
50th percentile
1 410 
98 875 
772 
140 K
60th percentile
1 550 
130 K
799 
163 K
70th percentile
1 942 
139 K
851 
174 K
80th percentile
2 143 
155 K
868 
192 K
90th percentile
2 251 
192 K
926 
211 K

National and departmental comparison

Evolution of the median price per m² of houses

Evolution of the median price per m² of apartments

Quarterly evolution

Evolution of the median price per m²

Evolution of the number of transactions

Quarterly data

Descending order
Quarter
Houses
house
transactions
Houses
house
Price per m²
Apartments
apt.
transactions
Apartments
apt.
Price per m²
2025 Q2
2
1 336 
2
960 
2025 Q1
5
2 105 
0
--- 
2024 Q4
6
1 306 
0
--- 
2024 Q3
3
1 348 
0
--- 
2024 Q2
8
1 632 
0
--- 
2024 Q1
3
1 738 
0
--- 
2023 Q4
6
1 406 
0
--- 
2023 Q3
6
1 468 
1
761 
2023 Q2
6
1 484 
1
682 
2023 Q1
7
1 667 
2
544 
2022 Q4
2
1 676 
1
603 
2022 Q3
5
1 200 
0
--- 
2022 Q2
9
1 515 
0
--- 
2022 Q1
9
1 427 
0
--- 
2021 Q4
5
1 368 
0
--- 
2021 Q3
6
1 583 
0
--- 
2021 Q2
10
1 506 
0
--- 
2021 Q1
7
1 122 
0
--- 
2020 Q4
2
1 343 
0
--- 
2020 Q3
4
995 
0
--- 
2020 Q2
10
1 288 
0
--- 
2020 Q1
3
1 400 
0
--- 
2019 Q4
6
1 625 
1
784 
2019 Q3
8
1 410 
0
--- 
2019 Q2
7
1 320 
0
--- 
2019 Q1
4
1 075 
0
--- 
2018 Q4
8
1 489 
0
--- 
2018 Q3
2
1 681 
0
--- 
2018 Q2
3
788 
0
--- 
2018 Q1
2
1 812 
0
--- 
2017 Q4
2
1 832 
0
--- 
2017 Q3
5
1 235 
0
--- 
2017 Q2
4
840 
0
--- 
2017 Q1
8
1 118 
0
--- 
2016 Q4
3
1 195 
0
--- 
2016 Q3
4
1 295 
1
1 133 
2016 Q2
5
1 408 
0
--- 
2016 Q1
7
1 161 
0
--- 
2015 Q4
7
1 389 
0
--- 
2015 Q3
5
1 441 
0
--- 
2015 Q2
3
1 481 
0
--- 
2015 Q1
4
1 898 
0
--- 
2014 Q4
4
1 486 
0
--- 
2014 Q3
3
1 500 
0
--- 
2014 Q2
3
1 222 
0
--- 
2014 Q1
3
1 750 
0
--- 

Overview of the latest real estate transactions

The following list is an anonymized overview of the latest transactions. For more details and to find all transactions, please use the map to view transactions by plot or the transaction search page for a search by criteria.

2025-06-19
52 500 
875  /m²(60 m²)
Sale
Apartments
Apartment
3 rooms
60 m2
2 outbuildings
2025-05-15
10 500 
Sale
Land
452 m2
-Terrains à bâtir
2025-04-30
48 000 
522  /m²(92 m²)
Sale
Houses
House
4 rooms
92 m2
1 outbuilding
Land
379 m2
-Sols
2025-04-30
144 000 
2 149  /m²(67 m²)
Sale
Houses
House
2 rooms
67 m2
Land
425 m2
-Sols
Land
592 m2
-Jardins
2025-04-24
106 000 
3 118  /m²(34 m²)
Sale
Houses
House
1 room
34 m2
Land
740 m2
-Sols
Commercial property
Land
2276 m2
-Sols
Land
322 m2
-Sols
Land
38 m2
-Sols
Land
417 m2
-Sols
Land
2921 m2
-Sols
Land
722 m2
-Eaux
/ETANG
Land
1498 m2
-Sols
2025-04-23
203 000 
1 046  /m²(194 m²)
Sale
Apartments
Apartment
3 rooms
69 m2
Apartments
Apartment
3 rooms
69 m2
Apartments
Apartment
2 rooms
56 m2
3 outbuildings
Land
275 m2
-Sols
2025-04-23
50 000 
Sale
Land
59950 m2
-Terres
Land
19980 m2
-Terres
2025-03-27
7 500 
Sale
Land
5317 m2
-Peupleraies
2025-03-13
184 000 
1 472  /m²(125 m²)
Sale
Houses
House
4 rooms
125 m2
2 outbuildings
Land
800 m2
-Sols
2025-03-10
45 000 
2 143  /m²(21 m²)
Sale
Houses
House
1 room
21 m2
Land
780 m2
-Sols
Land
763 m2
-Eaux
/ETANG
2025-03-03
240 000 
2 353  /m²(102 m²)
Sale
Houses
House
5 rooms
102 m2
Land
972 m2
-Sols
2025-02-28
200 000 
2 105  /m²(95 m²)
Sale
Houses
House
4 rooms
95 m2
Land
1183 m2
-Prés
2025-01-30
15 000 
Sale
Commercial property
Land
2276 m2
-Sols
Land
322 m2
-Sols
Land
38 m2
-Sols
Land
417 m2
-Sols
Land
1781 m2
-Eaux
/ETANG
Land
260 m2
-Terrains d'agrément
Land
2921 m2
-Sols
Land
1498 m2
-Sols
2025-01-30
230 000 
1 438  /m²(160 m²)
Sale
Commercial property
160 m2
Land
178 m2
-Sols
2025-01-20
50 000 
746  /m²(67 m²)
Sale
Houses
House
4 rooms
67 m2
Land
651 m2
-Terrains d'agrément
Land
500 m2
-Sols
2024-12-27
60 000 
Sale
Land
3620 m2
-Terrains d'agrément
Land
20052 m2
-Eaux
/ETANG
Land
20051 m2
-Eaux
/ETANG
2024-12-17
43 687 
Sale
Land
2815 m2
-Eaux
/ETANG
Land
340 m2
-Eaux
/ETANG
Land
19455 m2
-Eaux
/ETANG
Land
338 m2
-Landes
/Friche
2024-12-09
73 000 
1 780  /m²(41 m²)
Sale
Houses
House
3 rooms
41 m2
Land
822 m2
-Sols
Land
959 m2
-Eaux
/ETANG
Land
552 m2
-Terrains d'agrément
Land
434 m2
-Sols
Land
1443 m2
-Sols
2024-12-03
85 000 
1 328  /m²(64 m²)
Sale
Houses
House
3 rooms
64 m2
1 outbuilding
Land
145 m2
-Sols
Land
166 m2
-Jardins
2024-11-25
1 
Exchange
Land
2206 m2
-Sols
Land
9 m2
-Terrains d'agrément
/Terrain de sport
373 transactions listed in the municipality

Somme (80)

Most expensive cities

City
name
Descending orderHouses
house
Price per m²
3 742 
3 474 
3 280 
3 012 
2 989 
2 986 
2 600 
2 529 
City
name
Descending orderApartments
apt.
Price per m²
8 100 
5 334 
4 178 
3 964 
3 905 
3 582 
3 144 
2 768 
2 635 

Least expensive cities

City
name
Ascending orderHouses
house
Price per m²
486 
500 
598 
625 
663 
673 
693 
City
name
Ascending orderApartments
apt.
Price per m²
161 
273 
331 
366 
428