Real estate price map
Real estate price map in the municipality of Ham, choose a section to see transactions by parcel.
Somme (80)
Price per m² in Ham
Median price of real estate
in the municipality of Ham
Houses
881 € /m²
Reliability 9/10
Median price on the 27 transactions of the last 6 months.
from 759 to
1 316 € /m²
1 316 € /m²
60% of transactions from the 2nd to the 8th deciles.
Apartments
694 € /m²
Reliability 5/10
Median price on the 10 transactions of the last 48 months.
Dwellings
881 € /m²
Reliability 9/10
Median price on the 27 transactions of the last 6 months.
from 759 to
1 316 € /m²
1 316 € /m²
60% of transactions from the 2nd to the 8th deciles.
Evolution of the price per m² of houses since...
1 year
-17%
2 years
-12%
3 years
-5.3%
4 years
-5.9%
5 years
+2.3%
6 years
-7.5%
7 years
-4%
8 years
+10%
9 years
-0.7%
10 years
-13%
11 years
-7.2%
The price per m² of houses has decreased by 17% since 1 year, but it has increased by 10% in 8 years.
879 transactions listed in the municipality
Yearly data
Yearly evolution of the median price per m²

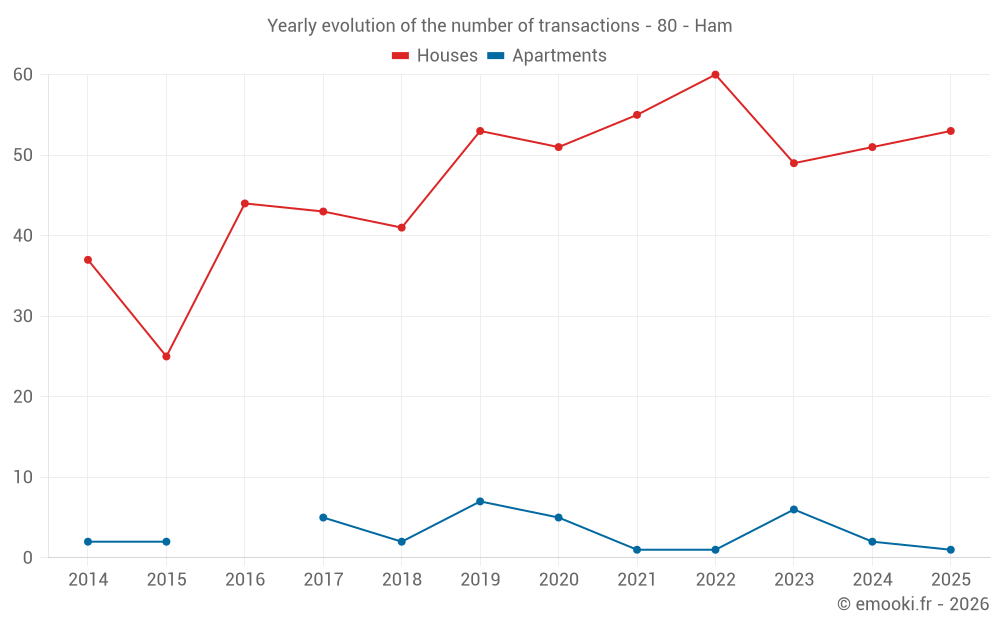
Yearly evolution of the number of transactions
Yearly table
Year
house
transactions
transactions
house
Price per m²
Price per m²
apt.
transactions
transactions
apt.
Price per m²
Price per m²
2025
53
902 €
1
489 €
2024
51
1 087 €
2
704 €
2023
49
1 027 €
6
714 €
2022
60
952 €
1
594 €
2021
55
959 €
1
626 €
2020
51
882 €
5
597 €
2019
53
975 €
7
761 €
2018
41
940 €
2
1 792 €
2017
43
822 €
5
588 €
2016
44
908 €
0
--- €
2015
25
1 032 €
2
365 €
2014
37
972 €
2
794 €
Analysis
Structure of prices per m²
Values of price percentiles per m² over the periods used for the estimated price of each type of property.
Structure of transaction amounts
Values of transaction amounts percentiles over the periods used for the estimated price of each type of property.
Transaction amounts and prices per m² by percentile
Percentile
house
Price per m²
Price per m²
house
Transaction amount
Transaction amount
apt.
Price per m²
Price per m²
apt.
Transaction amount
Transaction amount
10th percentile
611 €
49 200 €
438 €
38 311 €
20th percentile
759 €
60 300 €
479 €
40 500 €
30th percentile
781 €
71 200 €
562 €
54 270 €
40th percentile
820 €
78 929 €
653 €
104 K€
50th percentile
881 €
90 000 €
694 €
134 K€
60th percentile
932 €
92 994 €
711 €
138 K€
70th percentile
1 080 €
108 K€
767 €
144 K€
80th percentile
1 316 €
130 K€
869 €
147 K€
90th percentile
1 420 €
165 K€
988 €
156 K€
National and departmental comparison
Evolution of the median price per m² of houses
Evolution of the median price per m² of apartments
Quarterly data
Quarterly evolution of the median price per m²
Quarterly evolution of the number of transactions
Quarterly table
Quarter
house
transactions
transactions
house
Price per m²
Price per m²
apt.
transactions
transactions
apt.
Price per m²
Price per m²
2025 Q4
11
833 €
0
--- €
2025 Q3
16
892 €
0
--- €
2025 Q2
14
1 104 €
0
--- €
2025 Q1
12
878 €
1
489 €
2024 Q4
19
1 081 €
0
--- €
2024 Q3
11
1 196 €
2
704 €
2024 Q2
6
1 105 €
0
--- €
2024 Q1
15
1 087 €
0
--- €
2023 Q4
14
946 €
1
695 €
2023 Q3
9
1 071 €
2
789 €
2023 Q2
13
1 083 €
2
936 €
2023 Q1
13
999 €
1
409 €
2022 Q4
14
1 163 €
0
--- €
2022 Q3
13
953 €
1
594 €
2022 Q2
11
933 €
0
--- €
2022 Q1
22
919 €
0
--- €
2021 Q4
9
915 €
0
--- €
2021 Q3
15
1 154 €
0
--- €
2021 Q2
14
868 €
1
626 €
2021 Q1
17
1 019 €
0
--- €
2020 Q4
13
875 €
0
--- €
2020 Q3
7
1 017 €
2
527 €
2020 Q2
18
872 €
2
742 €
2020 Q1
13
818 €
1
513 €
2019 Q4
9
976 €
1
513 €
2019 Q3
13
769 €
2
754 €
2019 Q2
19
1 042 €
4
775 €
2019 Q1
12
982 €
0
--- €
2018 Q4
11
917 €
1
2 835 €
2018 Q3
13
933 €
0
--- €
2018 Q2
10
838 €
1
750 €
2018 Q1
7
1 237 €
0
--- €
2017 Q4
7
889 €
1
397 €
2017 Q3
12
870 €
1
688 €
2017 Q2
15
880 €
2
964 €
2017 Q1
9
736 €
1
539 €
2016 Q4
9
1 033 €
0
--- €
2016 Q3
9
835 €
0
--- €
2016 Q2
16
847 €
0
--- €
2016 Q1
10
1 086 €
0
--- €
2015 Q4
6
1 089 €
0
--- €
2015 Q3
7
1 038 €
1
217 €
2015 Q2
5
763 €
0
--- €
2015 Q1
7
1 055 €
1
513 €
2014 Q4
7
972 €
1
1 053 €
2014 Q3
12
1 076 €
0
--- €
2014 Q2
7
938 €
1
535 €
2014 Q1
11
767 €
0
--- €
Key takeaways
What is the price per m2 of houses in Ham?
The median price on the 27 house transactions of the last 6 months in the municipality of Ham was 881 € per square meter for a median property value of 90 000 €. Over this period, 60% of transactions were between 759 and 1 316 € per square meter (from the 2nd to the 8th deciles).
Compare with neighboring municipalities
City
name
name
house
Price per m²
Price per m²
apt.
Price per m²
Price per m²
City information
Zip code
- 80400 HAM