Median price of real estate
in the municipality of Flixecourt
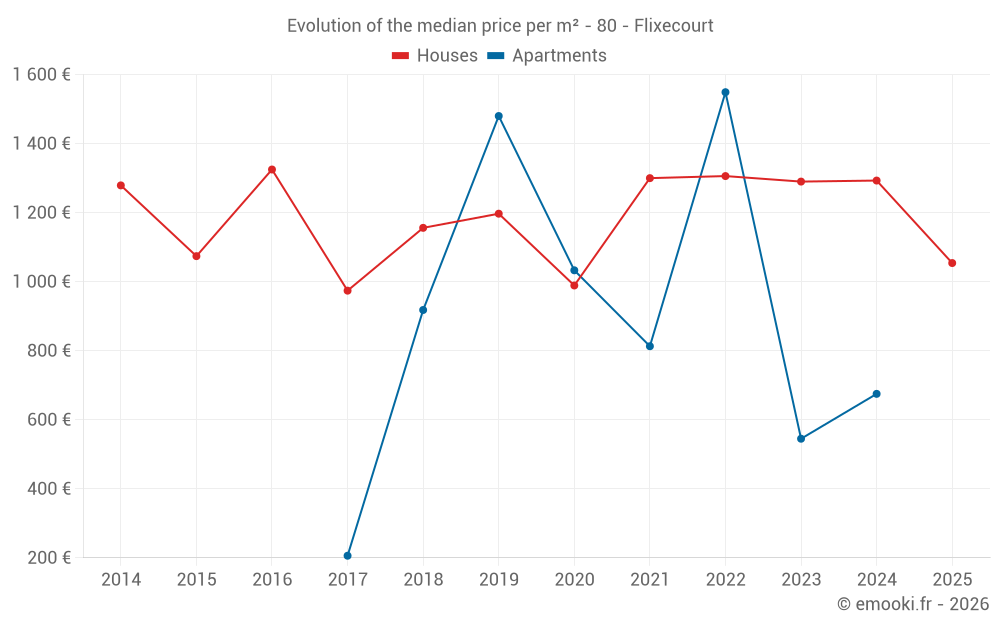
Houses
1 071 € /m²
Reliability 8/10
Median price on the 27 transactions of the last 12 months.
from 738 to
1 729 € /m²
1 729 € /m²
60% of transactions from the 2nd to the 8th deciles.
Apartments
918 € /m²
Reliability 2/10
Median price on the 7 transactions of the last 96 months.
Dwellings
1 054 € /m²
Reliability 8/10
Median price on the 28 transactions of the last 12 months.
from 717 to
1 696 € /m²
1 696 € /m²
60% of transactions from the 2nd to the 8th deciles.