Median price of real estate
in the municipality of Flers-sur-Noye
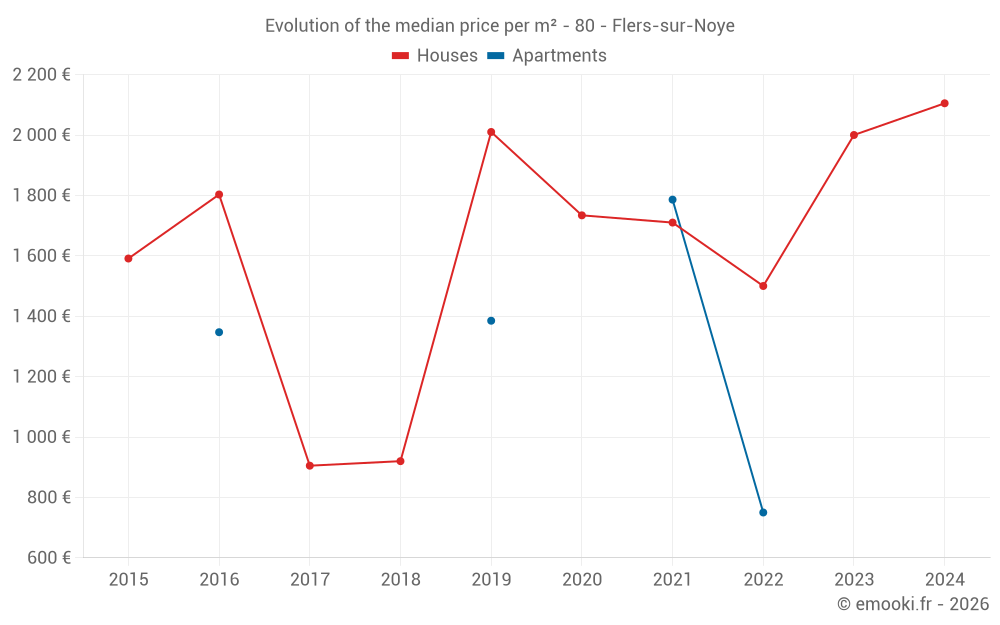
Houses
1 923 € /m²
Reliability 5/10
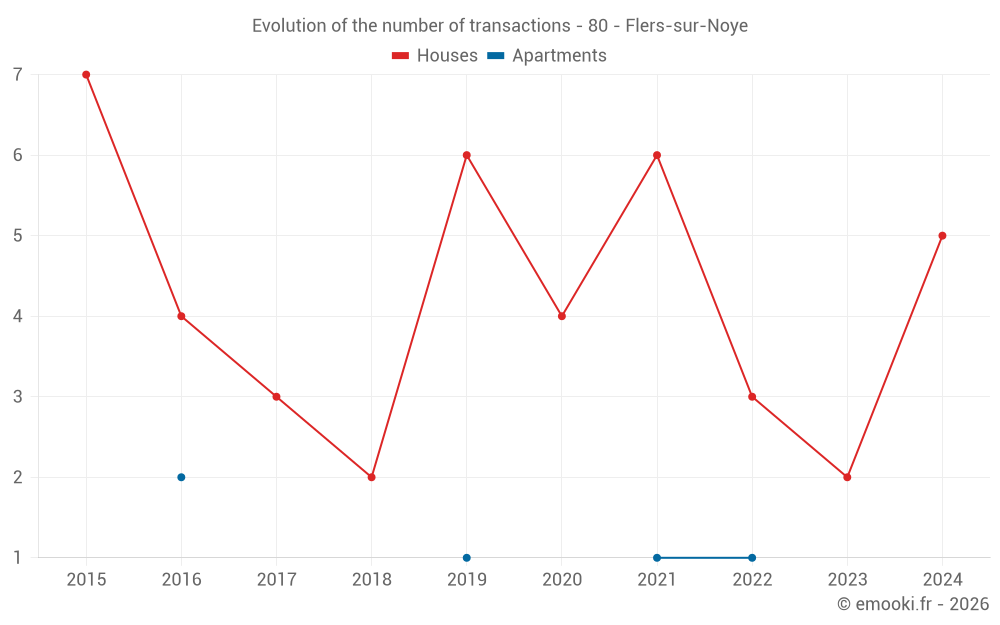
Median price on the 12 transactions of the last 48 months.
from 1 362 to
2 449 € /m²
2 449 € /m²
60% of transactions from the 2nd to the 8th deciles.
Apartments
1 357 € /m²
Reliability 1/10
Median price on the 5 transactions of the last 120 months.
Dwellings
1 871 € /m²
Reliability 5/10
Median price on the 13 transactions of the last 48 months.
from 1 327 to
2 369 € /m²
2 369 € /m²
60% of transactions from the 2nd to the 8th deciles.