emooki
HomePrice mapTransactions
🇬🇧 English🇫🇷 Français🇩🇪 Deutsch🇪🇸 Español🇮🇹 Italiano

Real estate price map


Real estate price map in the municipality of Vernouillet, choose a section to see transactions by parcel.

Yvelines (78)

Vernouillet - Real estate price m²

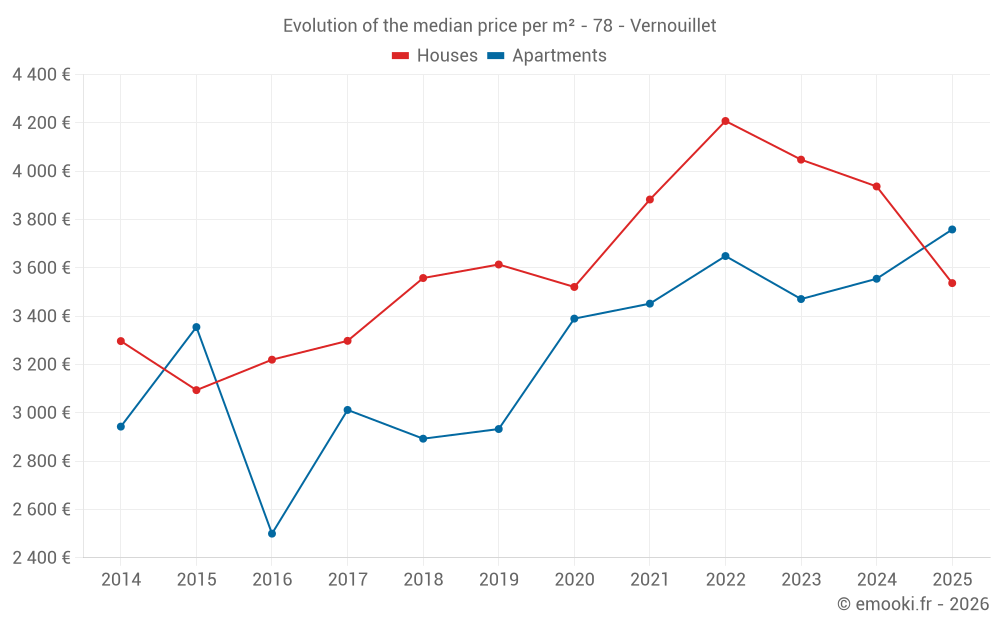
Median price of real estate
in the municipality of Vernouillet

HousesHouses
3 537  /m²
1-23-45-67-89-10
Reliability 9/10
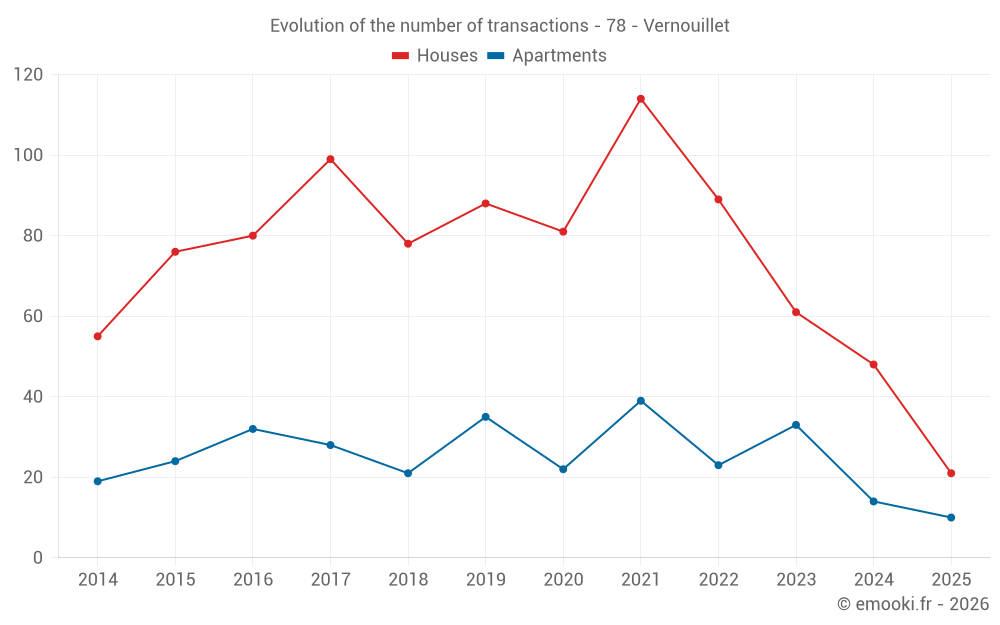
Median price on the 21 transactions of the last 6 months.
from 3 080 to
4 783  /m²
60% of transactions from the 2nd to the 8th deciles.
ApartmentsApartments
3 558  /m²
1-23-45-67-89-10
Reliability 7/10
Median price on the 44 transactions of the last 24 months.
from 2 847 to
3 995  /m²
60% of transactions from the 2nd to the 8th deciles.
DwellingsDwellings
3 600  /m²
1-23-45-67-89-10
Reliability 9/10
Median price on the 31 transactions of the last 6 months.
from 3 080 to
4 250  /m²
60% of transactions from the 2nd to the 8th deciles.
HousesEvolution of the price per m² of houses since...
1 year
-10%
2 years
-13%
3 years
-16%
4 years
-8.9%
5 years
+0.5%
6 years
-2.1%
7 years
-0.6%
8 years
+7.2%
9 years
+10%
10 years
+14%
11 years
+7.3%
The price per m² of houses has decreased by 16% since 3 years, but it has increased by 14% in 10 years.
ApartmentsEvolution of the price per m² of apartments since...
1 year
+5.7%
2 years
+8.3%
3 years
+3%
4 years
+8.9%
5 years
+11%
6 years
+28%
7 years
+30%
8 years
+25%
9 years
+50%
10 years
+12%
11 years
+28%

Yearly evolution

Evolution of the median price per m²

Evolution of the median price per m² - 78 - Vernouillet

Evolution of the number of transactions

Warning, last year incomplete. Projections made based on the proportions between semesters of the previous year at the departmental/national level and by type of property.

Evolution of the number of transactions - 78 - Vernouillet

Yearly data

Descending order
Year
Houses
house
transactions
Houses
house
Price per m²
Apartments
apt.
transactions
Apartments
apt.
Price per m²
2025
21
3 537 
10
3 759 
2024
48
3 937 
14
3 555 
2023
61
4 048 
33
3 471 
2022
89
4 208 
23
3 649 
2021
114
3 883 
39
3 452 
2020
81
3 521 
22
3 390 
2019
88
3 614 
35
2 933 
2018
78
3 558 
21
2 893 
2017
99
3 298 
28
3 012 
2016
80
3 220 
32
2 500 
2015
76
3 094 
24
3 355 
2014
55
3 297 
19
2 943 

Analysis

Structure of prices per m²

Values of price percentiles per m² over the periods used for the estimated price of each type of property.

Structure of transaction amounts

Values of transaction amounts percentiles over the periods used for the estimated price of each type of property.

Transaction amounts and prices per m² by percentile

Ascending order
Percentile
Houses
house
Price per m²
Houses
house
Transaction amount
Apartments
apt.
Price per m²
Apartments
apt.
Transaction amount
10th percentile
2 828 
244 K
2 596 
112 K
20th percentile
3 080 
300 K
2 847 
125 K
30th percentile
3 220 
386 K
3 354 
150 K
40th percentile
3 414 
397 K
3 483 
178 K
50th percentile
3 537 
465 K
3 558 
185 K
60th percentile
3 607 
510 K
3 663 
189 K
70th percentile
3 693 
549 K
3 846 
202 K
80th percentile
4 783 
590 K
3 995 
252 K
90th percentile
5 172 
750 K
4 232 
309 K

National and departmental comparison

Evolution of the median price per m² of houses

Evolution of the median price per m² of apartments

Quarterly evolution

Evolution of the median price per m²

Evolution of the number of transactions

Quarterly data

Descending order
Quarter
Houses
house
transactions
Houses
house
Price per m²
Apartments
apt.
transactions
Apartments
apt.
Price per m²
2025 Q2
12
3 492 
4
4 042 
2025 Q1
9
3 566 
6
3 591 
2024 Q4
20
4 521 
4
3 970 
2024 Q3
12
3 570 
1
2 609 
2024 Q2
5
4 420 
3
3 552 
2024 Q1
11
3 789 
6
3 476 
2023 Q4
13
3 929 
9
3 308 
2023 Q3
18
3 920 
11
3 516 
2023 Q2
12
4 524 
7
3 642 
2023 Q1
18
4 290 
6
3 256 
2022 Q4
7
4 238 
6
4 192 
2022 Q3
32
4 220 
9
3 382 
2022 Q2
30
4 328 
5
3 593 
2022 Q1
20
3 958 
3
3 615 
2021 Q4
22
4 182 
5
3 452 
2021 Q3
49
3 913 
14
3 721 
2021 Q2
20
3 635 
13
3 358 
2021 Q1
23
3 943 
7
3 364 
2020 Q4
24
3 470 
5
3 294 
2020 Q3
24
3 934 
4
3 657 
2020 Q2
21
3 294 
6
3 204 
2020 Q1
12
3 830 
7
2 205 
2019 Q4
26
3 846 
8
3 106 
2019 Q3
22
3 674 
15
2 933 
2019 Q2
22
3 196 
7
2 416 
2019 Q1
18
3 350 
5
3 426 
2018 Q4
19
3 228 
6
2 722 
2018 Q3
27
3 807 
5
2 964 
2018 Q2
18
3 508 
4
2 839 
2018 Q1
14
3 451 
6
2 834 
2017 Q4
20
3 332 
6
2 814 
2017 Q3
30
3 329 
8
3 246 
2017 Q2
29
3 162 
5
3 027 
2017 Q1
20
3 262 
9
2 857 
2016 Q4
21
3 235 
6
2 096 
2016 Q3
27
3 161 
10
2 522 
2016 Q2
22
3 214 
6
2 656 
2016 Q1
10
3 230 
10
2 574 
2015 Q4
22
3 086 
5
3 157 
2015 Q3
29
3 056 
6
3 536 
2015 Q2
14
3 122 
5
3 413 
2015 Q1
11
3 239 
8
3 198 
2014 Q4
10
3 270 
7
3 118 
2014 Q3
23
3 134 
4
2 815 
2014 Q2
11
3 431 
5
2 940 
2014 Q1
11
3 163 
3
2 582 

Overview of the latest real estate transactions

The following list is an anonymized overview of the latest transactions. For more details and to find all transactions, please use the map to view transactions by plot or the transaction search page for a search by criteria.

2025-06-20
96 140 
907  /m²(106 m²)
Sale
Houses
House
4 rooms
106 m2
1 outbuilding
Land
557 m2
-Sols
2025-06-18
397 000 
5 754  /m²(69 m²)
Sale
Houses
House
4 rooms
69 m2
Land
566 m2
-Sols
2025-06-18
220 000 
2 750  /m²(80 m²)
Sale
Commercial property
80 m2
2025-06-13
150 000 
4 167  /m²(36 m²)
Sale
Apartments
Apartment
2 rooms
36 m2
1 outbuilding
2025-05-27
580 000 
3 537  /m²(164 m²)
Sale
Houses
House
7 rooms
164 m2
Land
583 m2
-Sols
2025-05-20
52 000 
Sale
1 outbuilding
5 outbuildings
2025-05-20
350 
Sale
Land
530 m2
-Terres
2025-05-13
300 000 
2 913  /m²(103 m²)
Sale
Houses
House
5 rooms
103 m2
Land
566 m2
-Sols
Land
34 m2
-Sols
Land
41 m2
-Sols
2025-05-07
2 168 
Sale
Land
350 m2
-Taillis simples
Land
135 m2
-Taillis simples
Land
414 m2
-Taillis simples
Land
107 m2
-Taillis simples
Land
825 m2
-Taillis simples
Land
310 m2
-Taillis simples
Land
250 m2
-Taillis simples
2025-04-30
352 500 
3 917  /m²(90 m²)
Sale
Apartments
Apartment
4 rooms
90 m2
1 outbuilding
2025-04-28
548 700 
2 828  /m²(194 m²)
Sale
Houses
House
7 rooms
194 m2
Land
870 m2
-Sols
2025-04-28
240 000 
Sale
Land
462 m2
-Terrains d'agrément
Land
284 m2
-Terrains d'agrément
2025-04-28
465 350 
3 693  /m²(126 m²)
Sale
Houses
House
5 rooms
126 m2
Land
336 m2
-Sols
2025-04-25
199 000 
3 685  /m²(54 m²)
Sale
Apartments
Apartment
3 rooms
54 m2
1 outbuilding
2025-04-24
386 000 
3 607  /m²(107 m²)
Sale
Houses
House
5 rooms
107 m2
2025-04-18
244 000 
3 211  /m²(76 m²)
Sale
Houses
House
4 rooms
76 m2
Land
520 m2
-Sols
2025-04-17
593 300 
3 640  /m²(163 m²)
Sale
Houses
House
6 rooms
163 m2
Land
735 m2
-Sols
2025-04-14
190 000 
3 220  /m²(59 m²)
Sale
Houses
House
4 rooms
59 m2
2 outbuildings
2025-04-09
491 200 
4 128  /m²(119 m²)
Sale
Houses
House
4 rooms
119 m2
1 outbuilding
Land
1000 m2
-Terrains d'agrément
Land
546 m2
-Sols
Land
96 m2
-Sols
Land
780 m2
-Taillis simples
Land
245 m2
-Taillis simples
Land
242 m2
-Taillis simples
2025-04-04
250 
Sale
Land
490 m2
-Terres
1640 transactions listed in the municipality

Yvelines (78)

Most expensive cities

City
name
Descending orderHouses
house
Price per m²
7 960 
7 952 
7 768 
7 675 
6 913 
6 748 
6 318 
City
name
Descending orderApartments
apt.
Price per m²
6 192 
5 628 
5 254 
5 250 
5 153 
5 098 
5 056 

Least expensive cities

City
name
Ascending orderHouses
house
Price per m²
1 871 
1 903 
1 953 
1 997 
2 143 
2 192 
2 238 
2 250 
2 254 
City
name
Ascending orderApartments
apt.
Price per m²
729 
1 274 
1 500 
1 526 
1 578 
1 594 
1 675 
1 710