emooki
SearchPrice mapTransactions
EnglishFrançaisDeutschEspañolItaliano

Real estate price map


Real estate price map in the municipality of Plaisir.

Yvelines (78)
Plaisir

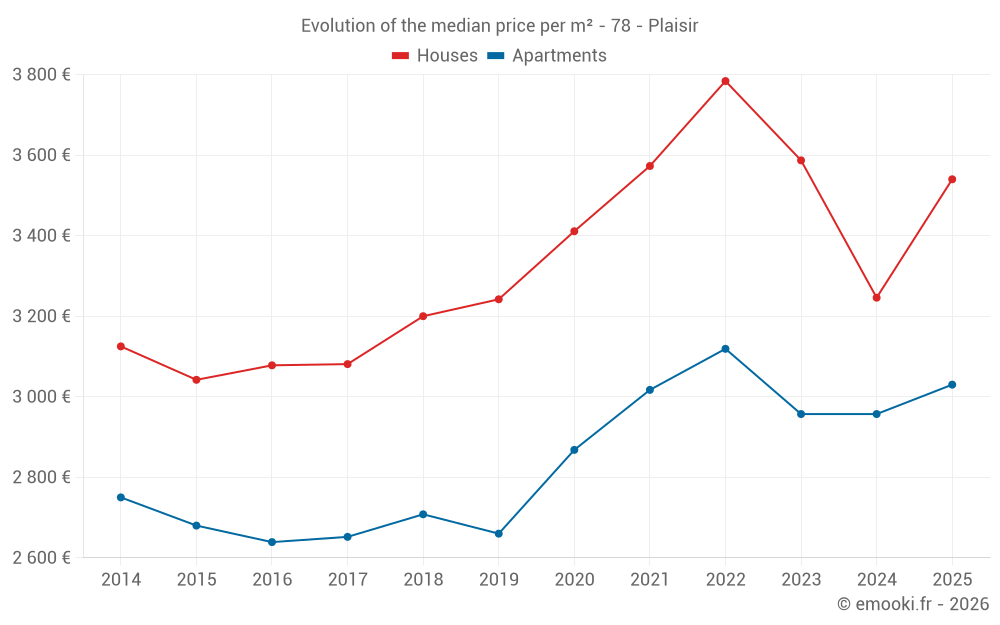
Median price of real estate
in the municipality of Plaisir

HousesHouses
3 375 € /m²
1-23-45-67-89-10
Reliability 10/10
Median price on the 21 transactions of the last 3 months.
from 2 880 to
3 734 € /m²
60% of transactions from the 2nd to the 8th deciles.
ApartmentsApartments
3 034 € /m²
1-23-45-67-89-10
Reliability 10/10
Median price on the 43 transactions of the last 3 months.
from 2 392 to
3 678 € /m²
60% of transactions from the 2nd to the 8th deciles.
DwellingsDwellings
3 171 € /m²
1-23-45-67-89-10
Reliability 10/10
Median price on the 64 transactions of the last 3 months.
from 2 648 to
3 699 € /m²
60% of transactions from the 2nd to the 8th deciles.
HousesEvolution of the price per m² of houses
1 year
+9.1%
2 years
-1.3%
3 years
-6.4%
4 years
-0.9%
5 years
+3.8%
6 years
+9.2%
7 years
+10.6%
8 years
+14.9%
9 years
+15%
10 years
+16.4%
11 years
+13.3%
ApartmentsEvolution of the price per m² of apartments
1 year
+2.5%
2 years
+2.5%
3 years
-2.9%
4 years
+0.4%
5 years
+5.6%
6 years
+13.9%
7 years
+11.9%
8 years
+14.3%
9 years
+14.8%
10 years
+13.1%
11 years
+10.2%

Yearly evolution

Median price per m²

Number of transactions

Warning, last year incomplete. Projections made based on the proportions between semesters of the previous year at the departmental/national level and by type of property.

Yearly data

Descending order
Year
Houses
house
Price per m²
Houses
house
transactions
Apartments
apt.
Price per m²
Apartments
apt.
transactions
2025
3 540 €
45
3 030 €
89
2024
3 246 €
91
2 957 €
165
2023
3 587 €
121
2 957 €
194
2022
3 784 €
174
3 119 €
281
2021
3 573 €
165
3 017 €
269
2020
3 411 €
155
2 868 €
260
2019
3 242 €
178
2 660 €
308
2018
3 200 €
160
2 708 €
264
2017
3 081 €
178
2 652 €
255
2016
3 078 €
166
2 639 €
202
2015
3 042 €
132
2 680 €
210
2014
3 125 €
121
2 750 €
199

Quarterly evolution

Median price per m²

Number of transactions

Analysis

Structure of prices per m²

Values of price percentiles per m² over the periods used for the estimated price of each type of property.

Yvelines (78)

Most expensive cities

City
name
Descending orderHouses
house
Price per m²
7 960 €
7 952 €
7 768 €
7 675 €
6 913 €
6 748 €
6 318 €
City
name
Descending orderApartments
apt.
Price per m²
6 192 €
5 628 €
5 254 €
5 250 €
5 153 €
5 098 €
5 056 €

Least expensive cities

City
name
Ascending orderHouses
house
Price per m²
1 871 €
1 903 €
1 953 €
1 997 €
2 143 €
2 192 €
2 238 €
2 250 €
2 254 €
City
name
Ascending orderApartments
apt.
Price per m²
729 €
1 274 €
1 500 €
1 526 €
1 578 €
1 594 €
1 675 €
1 710 €
emooki
Real estate statistics based on property value requests (DVF)
Need a specific analysis or dashboards, contact us