Real estate price map
Real estate price map in the municipality of Petit-Caux, choose a section to see transactions by parcel.
Price per m² in Petit-Caux
Median price of real estate
in the municipality of Petit-Caux
2 540 € /m²
2 539 € /m²
1828 transactions listed in the municipality
Yearly data
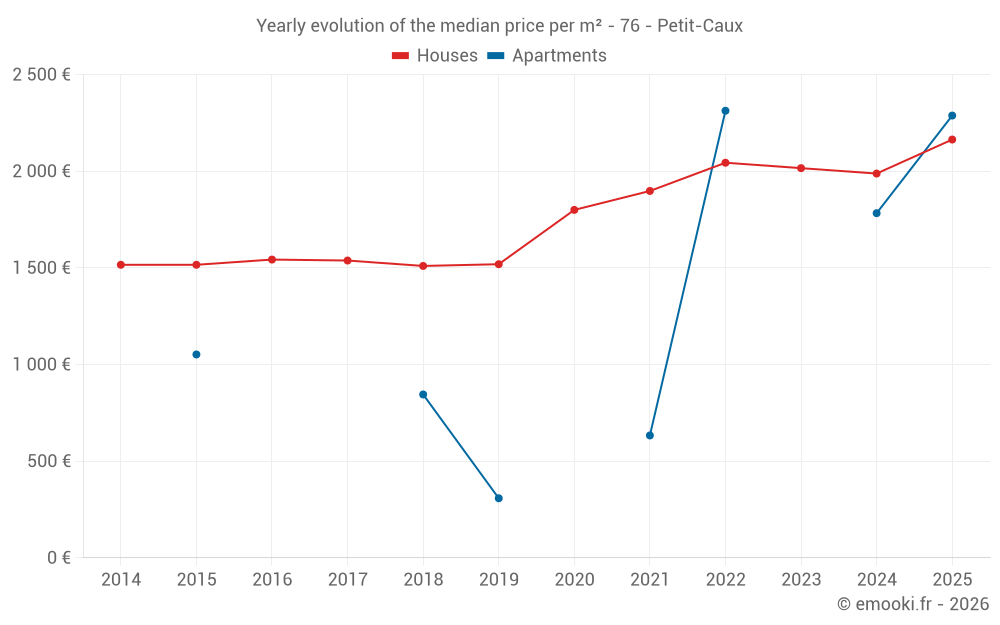
Yearly evolution of the median price per m²
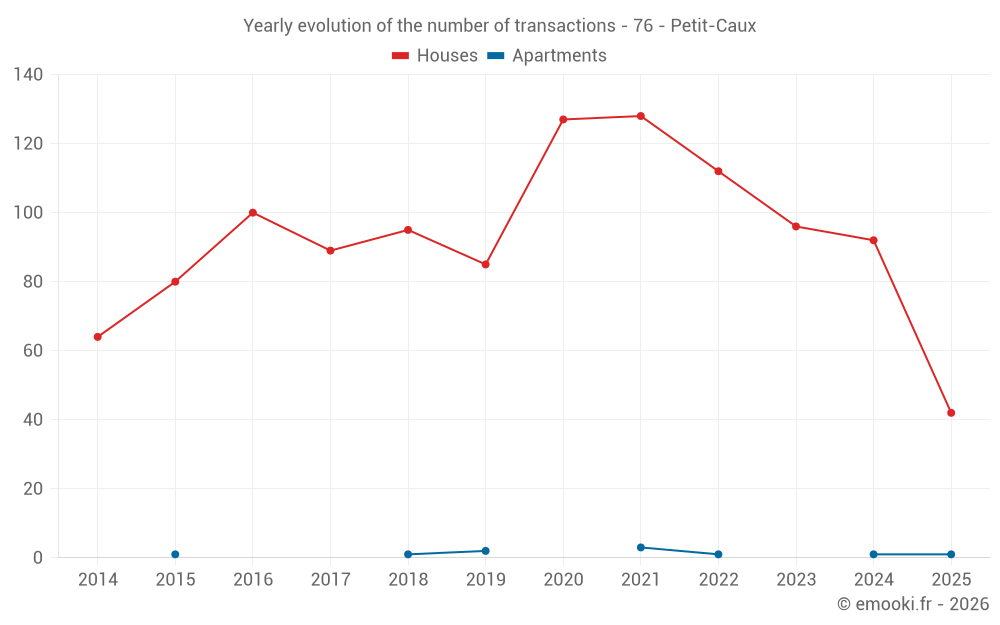
Yearly evolution of the number of transactions
Warning, last year incomplete. Projections made based on the proportions between semesters of the previous year at the departmental/national level and by type of property.
Yearly table
transactions
Price per m²
transactions
Price per m²
Analysis
Structure of prices per m²
Values of price percentiles per m² over the periods used for the estimated price of each type of property.
Structure of transaction amounts
Values of transaction amounts percentiles over the periods used for the estimated price of each type of property.
Transaction amounts and prices per m² by percentile
Price per m²
Transaction amount
Price per m²
Transaction amount
National and departmental comparison
Evolution of the median price per m² of houses
Evolution of the median price per m² of apartments
Quarterly data
Quarterly evolution of the median price per m²
Quarterly evolution of the number of transactions
Quarterly table
transactions
Price per m²
transactions
Price per m²
Key takeaways
What is the price per m2 of houses in Petit-Caux?
The median price on the 42 house transactions of the last 6 months in the municipality of Petit-Caux was 2 164 € per square meter for a median property value of 185 750 €. Over this period, 60% of transactions were between 1 574 and 2 540 € per square meter (from the 2nd to the 8th deciles).
Compare with neighboring municipalities
name
Price per m²
Price per m²
City information
Zip codes
- BELLEVILLE SUR MER 76370 PETIT CAUX
- BERNEVAL LE GRAND 76370 PETIT CAUX
- BRACQUEMONT 76370 PETIT CAUX
- DERCHIGNY 76370 PETIT CAUX
- ST MARTIN EN CAMPAGNE 76370 PETIT CAUX
- ASSIGNY 76630 PETIT CAUX
- AUQUEMESNIL 76630 PETIT CAUX
- BIVILLE SUR MER 76630 PETIT CAUX
- BRUNVILLE 76630 PETIT CAUX
- GLICOURT 76630 PETIT CAUX
- GOUCHAUPRE 76630 PETIT CAUX
- GRENY 76630 PETIT CAUX
- GUILMECOURT 76630 PETIT CAUX
- INTRAVILLE 76630 PETIT CAUX
- PENLY 76630 PETIT CAUX
- ST QUENTIN AU BOSC 76630 PETIT CAUX
- TOURVILLE LA CHAPELLE 76630 PETIT CAUX
- TOCQUEVILLE SUR EU 76910 PETIT CAUX