emooki
HomePrice mapTransactions
🇬🇧 English🇫🇷 Français🇩🇪 Deutsch🇪🇸 Español🇮🇹 Italiano

Real estate price map


Real estate price map in the municipality of Ménonval.

Seine-Maritime (76)
Ménonval

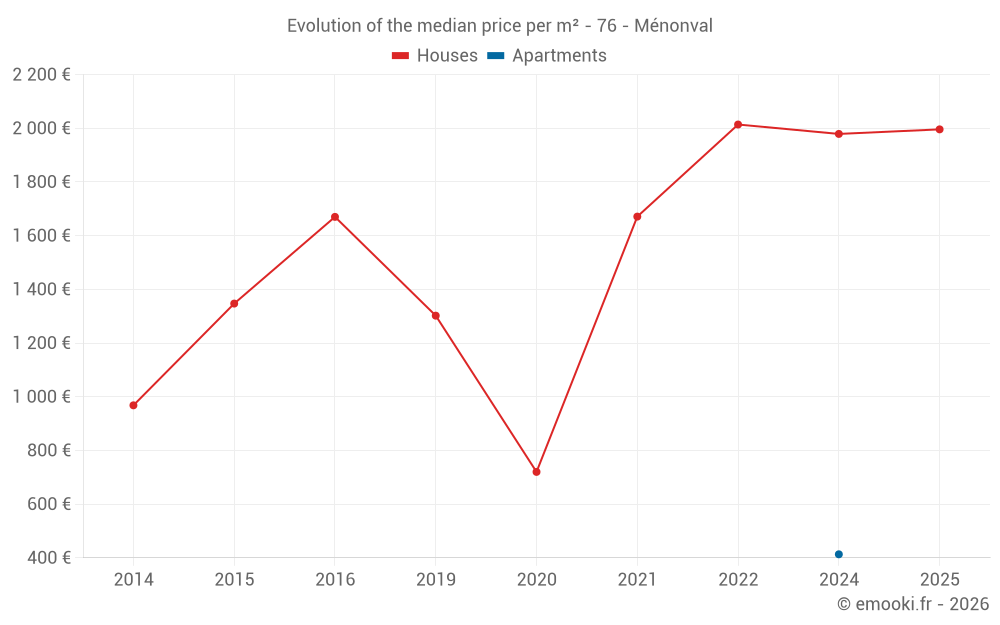
Median price of real estate
in the municipality of Ménonval

HousesHouses
2 014  /m²
1-23-45-67-89-10
Reliability 5/10
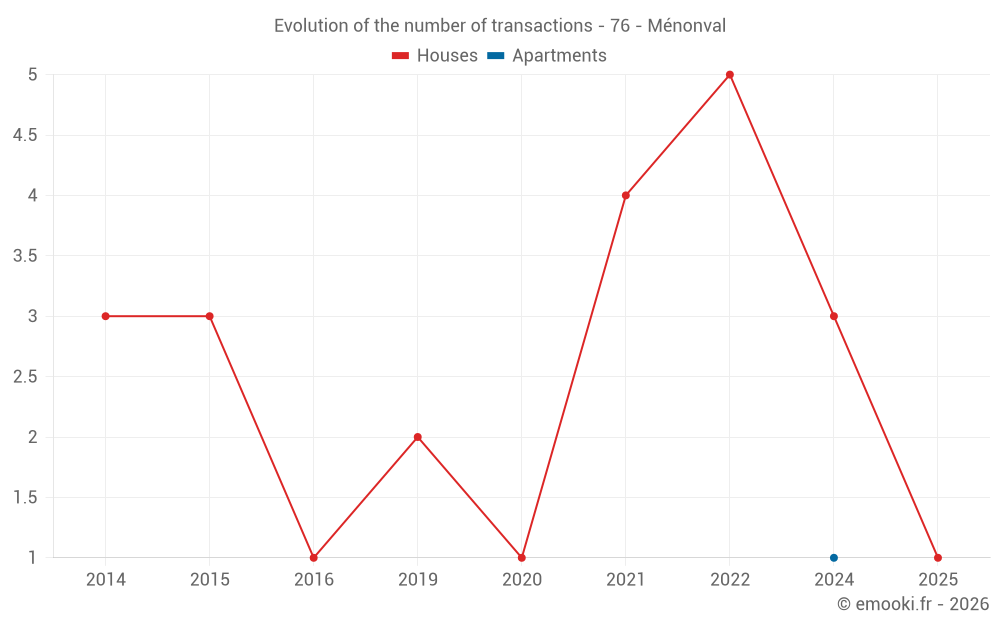
Median price on the 11 transactions of the last 48 months.
from 1 859 to
2 100  /m²
60% of transactions from the 2nd to the 8th deciles.
ApartmentsApartments
413  /m²
1-23-45-67-89-10
Reliability 1/10
Price of the unique transaction of the last 120 months.
DwellingsDwellings
2 005  /m²
1-23-45-67-89-10
Reliability 5/10
Median price on the 12 transactions of the last 48 months.
from 1 790 to
2 098  /m²
60% of transactions from the 2nd to the 8th deciles.
HousesEvolution of the price per m² of houses since...
1 year
--
2 years
--
3 years
--
4 years
--
5 years
--
6 years
--
7 years
--
8 years
--
9 years
--
10 years
--
11 years
--
ApartmentsEvolution of the price per m² of apartments since...
1 year
--
2 years
--
3 years
--
4 years
--
5 years
--
6 years
--
7 years
--
8 years
--
9 years
--
10 years
--
11 years
--

Yearly evolution

Evolution of the median price per m²

Evolution of the number of transactions

Warning, last year incomplete. Projections made based on the proportions between semesters of the previous year at the departmental/national level and by type of property.

Yearly data

Descending order
Year
Houses
house
transactions
Houses
house
Price per m²
Apartments
apt.
transactions
Apartments
apt.
Price per m²
2025
1
1 996 
0
--- 
2024
3
1 979 
1
413 
2023
0
--- 
0
--- 
2022
5
2 014 
0
--- 
2021
4
1 671 
0
--- 
2020
1
720 
0
--- 
2019
2
1 302 
0
--- 
2018
0
--- 
0
--- 
2017
0
--- 
0
--- 
2016
1
1 670 
0
--- 
2015
3
1 347 
0
--- 
2014
3
968 
0
--- 

Analysis

Structure of prices per m²

Values of price percentiles per m² over the periods used for the estimated price of each type of property.

Structure of transaction amounts

Values of transaction amounts percentiles over the periods used for the estimated price of each type of property.

Transaction amounts and prices per m² by percentile

Ascending order
Percentile
Houses
house
Price per m²
Houses
house
Transaction amount
Apartments
apt.
Price per m²
Apartments
apt.
Transaction amount
10th percentile
1 773 
140 K
413 
125 K
20th percentile
1 859 
145 K
413 
125 K
30th percentile
1 979 
179 K
413 
125 K
40th percentile
1 996 
180 K
413 
125 K
50th percentile
2 014 
185 K
413 
125 K
60th percentile
2 045 
190 K
413 
125 K
70th percentile
2 090 
192 K
413 
125 K
80th percentile
2 100 
195 K
413 
125 K
90th percentile
2 409 
227 K
413 
125 K

National and departmental comparison

Evolution of the median price per m² of houses

Evolution of the median price per m² of apartments

Quarterly evolution

Evolution of the median price per m²

Evolution of the number of transactions

Quarterly data

Descending order
Quarter
Houses
house
transactions
Houses
house
Price per m²
Apartments
apt.
transactions
Apartments
apt.
Price per m²
2025 Q1
1
1 996 
0
--- 
2024 Q4
1
1 773 
0
--- 
2024 Q3
1
1 979 
1
413 
2024 Q1
1
2 090 
0
--- 
2022 Q4
2
1 538 
0
--- 
2022 Q3
1
1 859 
0
--- 
2022 Q2
1
2 984 
0
--- 
2022 Q1
1
2 014 
0
--- 
2021 Q4
1
2 100 
0
--- 
2021 Q3
1
2 409 
0
--- 
2021 Q2
2
1 002 
0
--- 
2020 Q4
1
720 
0
--- 
2019 Q3
1
2 125 
0
--- 
2019 Q2
1
480 
0
--- 
2016 Q3
1
1 670 
0
--- 
2015 Q3
2
1 016 
0
--- 
2015 Q1
1
1 500 
0
--- 
2014 Q3
1
968 
0
--- 
2014 Q2
2
931 
0
--- 

Seine-Maritime (76)

Most expensive cities

City
name
Descending orderHouses
house
Price per m²
4 144 
3 774 
3 243 
3 190 
3 077 
3 032 
2 984 
2 940 
City
name
Descending orderApartments
apt.
Price per m²
3 761 
3 293 
3 278 
3 178 
2 959 

Least expensive cities

City
name
Ascending orderHouses
house
Price per m²
588 
686 
722 
819 
888 
938 
1 071 
1 104 
1 111 
City
name
Ascending orderApartments
apt.
Price per m²
413 
475 
489 
542 
587