emooki
HomePrice mapTransactions
🇬🇧 English🇫🇷 Français🇩🇪 Deutsch🇪🇸 Español🇮🇹 Italiano

Real estate price map


Real estate price map in the municipality of Neufchâtel-en-Bray.

Seine-Maritime (76)
Neufchâtel-en-Bray

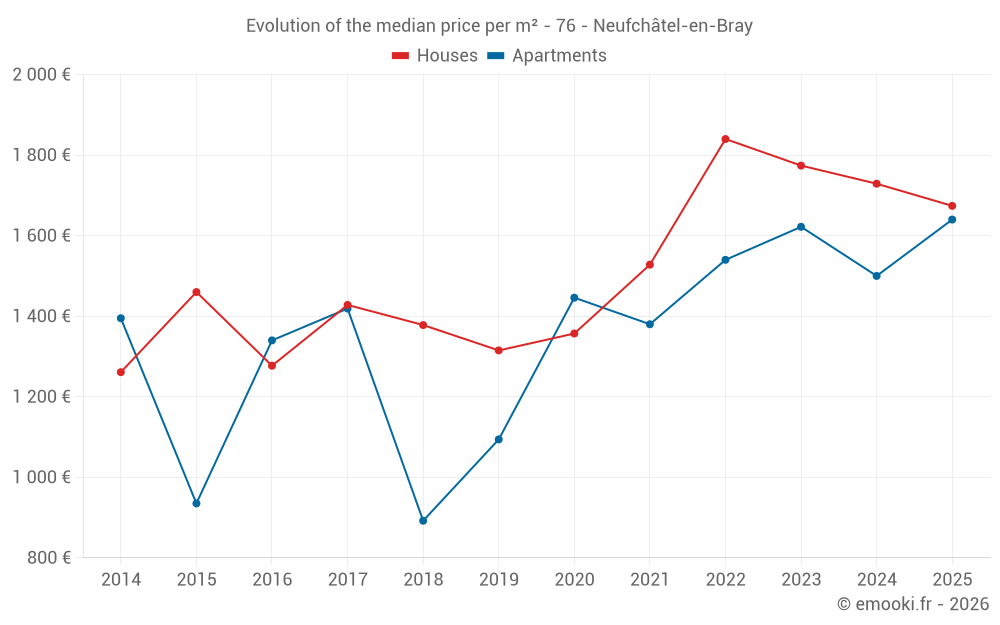
Median price of real estate
in the municipality of Neufchâtel-en-Bray

HousesHouses
1 674  /m²
1-23-45-67-89-10
Reliability 9/10
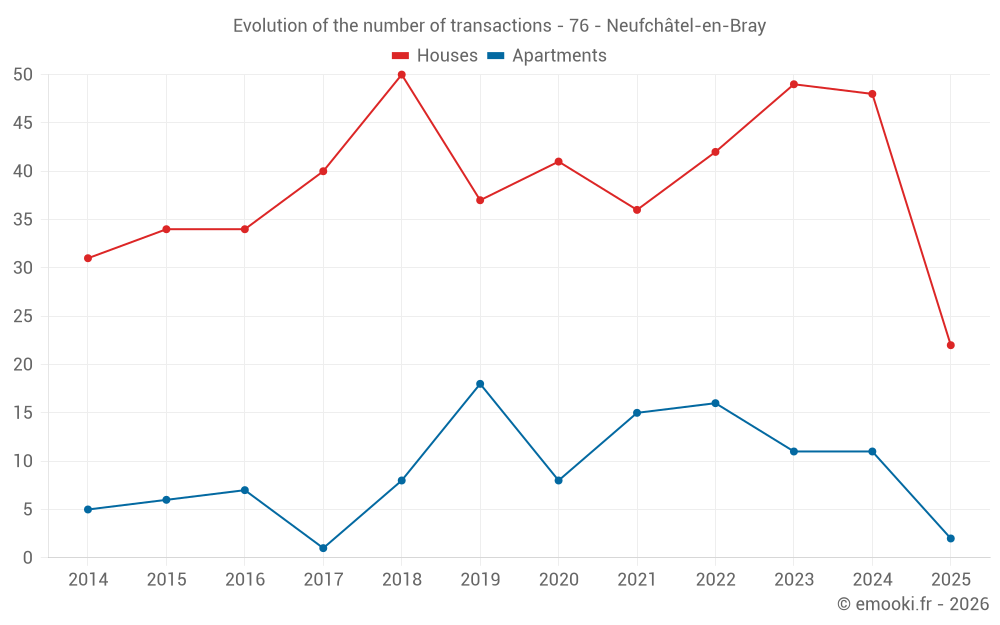
Median price on the 22 transactions of the last 6 months.
from 1 258 to
2 533  /m²
60% of transactions from the 2nd to the 8th deciles.
ApartmentsApartments
1 541  /m²
1-23-45-67-89-10
Reliability 7/10
Median price on the 15 transactions of the last 24 months.
from 1 389 to
1 708  /m²
60% of transactions from the 2nd to the 8th deciles.
DwellingsDwellings
1 674  /m²
1-23-45-67-89-10
Reliability 9/10
Median price on the 24 transactions of the last 6 months.
from 1 257 to
2 468  /m²
60% of transactions from the 2nd to the 8th deciles.
HousesEvolution of the price per m² of houses since...
1 year
-3.2%
2 years
-5.6%
3 years
-9%
4 years
+10%
5 years
+23%
6 years
+27%
7 years
+21%
8 years
+17%
9 years
+31%
10 years
+15%
11 years
+33%
ApartmentsEvolution of the price per m² of apartments since...
1 year
--
2 years
--
3 years
--
4 years
--
5 years
--
6 years
--
7 years
--
8 years
--
9 years
--
10 years
--
11 years
--

Yearly evolution

Evolution of the median price per m²

Evolution of the number of transactions

Warning, last year incomplete. Projections made based on the proportions between semesters of the previous year at the departmental/national level and by type of property.

Yearly data

Descending order
Year
Houses
house
transactions
Houses
house
Price per m²
Apartments
apt.
transactions
Apartments
apt.
Price per m²
2025
22
1 674 
2
1 640 
2024
48
1 729 
11
1 500 
2023
49
1 774 
11
1 622 
2022
42
1 840 
16
1 540 
2021
36
1 528 
15
1 380 
2020
41
1 357 
8
1 446 
2019
37
1 315 
18
1 094 
2018
50
1 378 
8
892 
2017
40
1 428 
1
1 419 
2016
34
1 277 
7
1 340 
2015
34
1 460 
6
935 
2014
31
1 261 
5
1 395 

Analysis

Structure of prices per m²

Values of price percentiles per m² over the periods used for the estimated price of each type of property.

Structure of transaction amounts

Values of transaction amounts percentiles over the periods used for the estimated price of each type of property.

Transaction amounts and prices per m² by percentile

Ascending order
Percentile
Houses
house
Price per m²
Houses
house
Transaction amount
Apartments
apt.
Price per m²
Apartments
apt.
Transaction amount
10th percentile
1 087 
83 398 
1 239 
34 200 
20th percentile
1 258 
103 K
1 389 
63 980 
30th percentile
1 433 
128 K
1 436 
74 200 
40th percentile
1 574 
147 K
1 481 
79 900 
50th percentile
1 674 
169 K
1 541 
82 000 
60th percentile
1 933 
175 K
1 602 
86 449 
70th percentile
2 225 
192 K
1 641 
106 K
80th percentile
2 533 
216 K
1 708 
123 K
90th percentile
2 777 
249 K
1 944 
150 K

National and departmental comparison

Evolution of the median price per m² of houses

Evolution of the median price per m² of apartments

Quarterly evolution

Evolution of the median price per m²

Evolution of the number of transactions

Quarterly data

Descending order
Quarter
Houses
house
transactions
Houses
house
Price per m²
Apartments
apt.
transactions
Apartments
apt.
Price per m²
2025 Q2
10
1 843 
1
1 261 
2025 Q1
12
1 614 
1
2 018 
2024 Q4
10
1 646 
2
1 442 
2024 Q3
14
1 891 
4
1 544 
2024 Q2
11
1 824 
3
1 541 
2024 Q1
13
1 657 
2
2 026 
2023 Q4
6
1 451 
2
1 727 
2023 Q3
13
1 620 
0
--- 
2023 Q2
13
1 948 
6
1 622 
2023 Q1
17
1 774 
3
1 500 
2022 Q4
13
1 875 
1
1 891 
2022 Q3
9
1 748 
5
1 741 
2022 Q2
9
2 417 
6
1 314 
2022 Q1
11
1 858 
4
1 508 
2021 Q4
9
1 488 
4
1 712 
2021 Q3
6
1 412 
5
1 515 
2021 Q2
13
1 690 
4
1 214 
2021 Q1
8
1 513 
2
1 315 
2020 Q4
16
1 248 
3
1 458 
2020 Q3
8
1 624 
0
--- 
2020 Q2
9
1 326 
4
1 520 
2020 Q1
8
1 398 
1
750 
2019 Q4
13
1 315 
5
1 368 
2019 Q3
10
1 376 
4
1 214 
2019 Q2
8
1 316 
6
974 
2019 Q1
6
1 405 
3
1 625 
2018 Q4
13
1 391 
3
1 010 
2018 Q3
13
1 432 
1
781 
2018 Q2
11
1 293 
3
909 
2018 Q1
13
1 307 
1
805 
2017 Q4
10
1 308 
0
--- 
2017 Q3
10
1 578 
0
--- 
2017 Q2
10
1 438 
1
1 419 
2017 Q1
10
1 414 
0
--- 
2016 Q4
8
1 404 
0
--- 
2016 Q3
7
1 281 
4
915 
2016 Q2
9
1 273 
1
2 111 
2016 Q1
10
1 148 
2
1 482 
2015 Q4
5
1 383 
2
1 092 
2015 Q3
16
1 509 
1
958 
2015 Q2
6
1 157 
3
912 
2015 Q1
7
1 437 
0
--- 
2014 Q4
9
1 042 
1
1 212 
2014 Q3
6
1 235 
1
4 849 
2014 Q2
9
1 445 
2
1 706 
2014 Q1
7
1 719 
1
1 369 

Seine-Maritime (76)

Most expensive cities

City
name
Descending orderHouses
house
Price per m²
4 144 
3 774 
3 243 
3 190 
3 077 
3 032 
2 984 
2 940 
City
name
Descending orderApartments
apt.
Price per m²
3 761 
3 293 
3 278 
3 178 
2 959 

Least expensive cities

City
name
Ascending orderHouses
house
Price per m²
588 
686 
722 
819 
888 
938 
1 071 
1 104 
1 111 
City
name
Ascending orderApartments
apt.
Price per m²
413 
475 
489 
542 
587