emooki
HomePrice mapTransactions
🇬🇧 English🇫🇷 Français🇩🇪 Deutsch🇪🇸 Español🇮🇹 Italiano

Real estate price map


Real estate price map in the municipality of Les Villards-sur-Thônes.

Haute-Savoie (74)
Les Villards-sur-Thônes

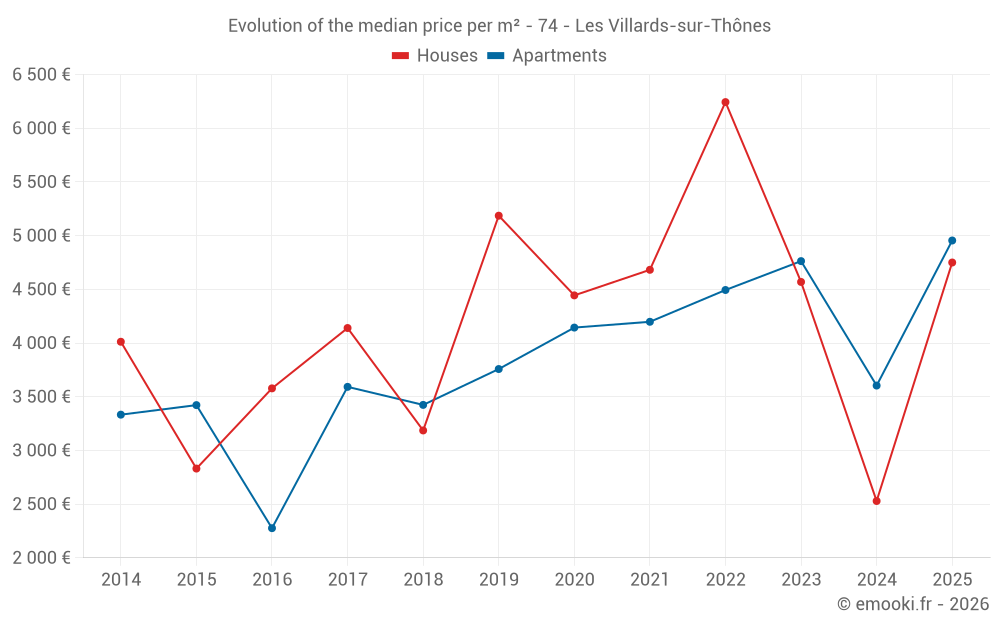
Median price of real estate
in the municipality of Les Villards-sur-Thônes

HousesHouses
4 660  /m²
1-23-45-67-89-10
Reliability 6/10
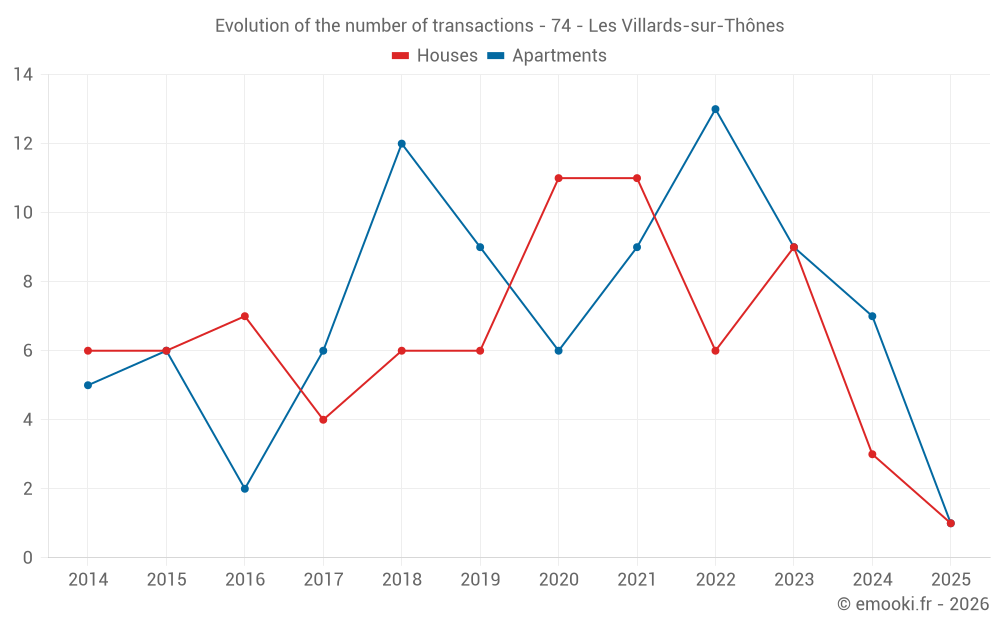
Median price on the 16 transactions of the last 36 months.
from 2 529 to
7 996  /m²
60% of transactions from the 2nd to the 8th deciles.
ApartmentsApartments
4 500  /m²
1-23-45-67-89-10
Reliability 6/10
Median price on the 25 transactions of the last 36 months.
from 3 330 to
5 698  /m²
60% of transactions from the 2nd to the 8th deciles.
DwellingsDwellings
4 660  /m²
1-23-45-67-89-10
Reliability 7/10
Median price on the 24 transactions of the last 24 months.
from 3 251 to
6 968  /m²
60% of transactions from the 2nd to the 8th deciles.
HousesEvolution of the price per m² of houses since...
1 year
--
2 years
--
3 years
--
4 years
--
5 years
--
6 years
--
7 years
--
8 years
--
9 years
--
10 years
--
11 years
--
ApartmentsEvolution of the price per m² of apartments since...
1 year
--
2 years
--
3 years
--
4 years
--
5 years
--
6 years
--
7 years
--
8 years
--
9 years
--
10 years
--
11 years
--

Yearly evolution

Evolution of the median price per m²

Evolution of the number of transactions

Warning, last year incomplete. Projections made based on the proportions between semesters of the previous year at the departmental/national level and by type of property.

Yearly data

Descending order
Year
Houses
house
transactions
Houses
house
Price per m²
Apartments
apt.
transactions
Apartments
apt.
Price per m²
2025
1
4 750 
1
4 955 
2024
3
2 529 
7
3 604 
2023
9
4 569 
9
4 763 
2022
6
6 244 
13
4 494 
2021
11
4 682 
9
4 198 
2020
11
4 444 
6
4 144 
2019
6
5 186 
9
3 758 
2018
6
3 186 
12
3 424 
2017
4
4 140 
6
3 592 
2016
7
3 578 
2
2 276 
2015
6
2 831 
6
3 422 
2014
6
4 012 
5
3 333 

Analysis

Structure of prices per m²

Values of price percentiles per m² over the periods used for the estimated price of each type of property.

Structure of transaction amounts

Values of transaction amounts percentiles over the periods used for the estimated price of each type of property.

Transaction amounts and prices per m² by percentile

Ascending order
Percentile
Houses
house
Price per m²
Houses
house
Transaction amount
Apartments
apt.
Price per m²
Apartments
apt.
Transaction amount
10th percentile
1 861 
108 K
2 389 
110 K
20th percentile
2 529 
190 K
3 330 
128 K
30th percentile
3 748 
229 K
3 619 
153 K
40th percentile
4 510 
400 K
4 310 
175 K
50th percentile
4 660 
448 K
4 500 
190 K
60th percentile
5 556 
499 K
4 609 
208 K
70th percentile
6 928 
585 K
5 387 
261 K
80th percentile
7 996 
903 K
5 698 
336 K
90th percentile
10 244 
1 448 K
6 262 
397 K

National and departmental comparison

Evolution of the median price per m² of houses

Evolution of the median price per m² of apartments

Quarterly evolution

Evolution of the median price per m²

Evolution of the number of transactions

Quarterly data

Descending order
Quarter
Houses
house
transactions
Houses
house
Price per m²
Apartments
apt.
transactions
Apartments
apt.
Price per m²
2025 Q1
1
4 750 
1
4 955 
2024 Q4
0
--- 
4
4 834 
2024 Q3
3
2 529 
0
--- 
2024 Q2
0
--- 
1
3 604 
2024 Q1
0
--- 
2
4 540 
2023 Q4
7
4 569 
4
5 026 
2023 Q3
1
7 917 
0
--- 
2023 Q2
1
4 348 
2
4 426 
2023 Q1
0
--- 
3
5 537 
2022 Q4
2
4 024 
5
4 500 
2022 Q3
1
21 000 
3
3 679 
2022 Q2
2
5 614 
3
4 574 
2022 Q1
1
6 549 
2
3 856 
2021 Q4
2
5 416 
2
2 575 
2021 Q3
3
2 768 
2
4 547 
2021 Q2
3
4 000 
2
3 222 
2021 Q1
3
4 797 
3
4 797 
2020 Q4
6
4 280 
2
2 488 
2020 Q3
4
5 402 
1
4 422 
2020 Q2
0
--- 
1
4 250 
2020 Q1
1
2 787 
2
4 072 
2019 Q4
2
4 834 
1
4 811 
2019 Q3
1
3 675 
5
3 915 
2019 Q2
1
5 233 
1
3 305 
2019 Q1
2
5 816 
2
1 876 
2018 Q4
2
2 690 
3
2 557 
2018 Q3
2
10 018 
2
3 596 
2018 Q2
1
438 
3
3 868 
2018 Q1
1
3 182 
4
2 842 
2017 Q4
2
3 862 
0
--- 
2017 Q3
1
4 541 
3
3 918 
2017 Q2
1
4 333 
2
3 350 
2017 Q1
0
--- 
1
3 524 
2016 Q4
3
5 167 
0
--- 
2016 Q2
2
2 562 
1
2 072 
2016 Q1
2
3 692 
1
2 479 
2015 Q4
2
5 945 
2
3 589 
2015 Q3
0
--- 
3
3 718 
2015 Q2
4
1 453 
0
--- 
2015 Q1
0
--- 
1
24 
2014 Q4
2
4 222 
2
3 112 
2014 Q3
2
3 718 
1
3 333 
2014 Q2
1
3 910 
1
3 673 
2014 Q1
1
2 094 
1
294 

Haute-Savoie (74)

Most expensive cities

City
name
Descending orderHouses
house
Price per m²
15 679 
13 070 
12 664 
12 078 
11 412 
11 019 
10 026 
9 621 
City
name
Descending orderApartments
apt.
Price per m²
9 603 
8 676 
8 394 
7 898 
7 778 
6 792 
6 625 
6 373 

Least expensive cities

City
name
Ascending orderHouses
house
Price per m²
2 070 
2 093 
2 300 
2 436 
2 611 
2 622 
2 709 
2 733 
City
name
Ascending orderApartments
apt.
Price per m²
725 
1 145 
1 250 
1 405 
1 448 
1 548 
1 628 
1 632 
1 674 
1 729