emooki
HomePrice mapTransactions
🇬🇧 English🇫🇷 Français🇩🇪 Deutsch🇪🇸 Español🇮🇹 Italiano

Real estate price map


Real estate price map in the municipality of Vallières-sur-Fier, choose a section to see transactions by parcel.

Haute-Savoie (74)
Vallières-sur-Fier

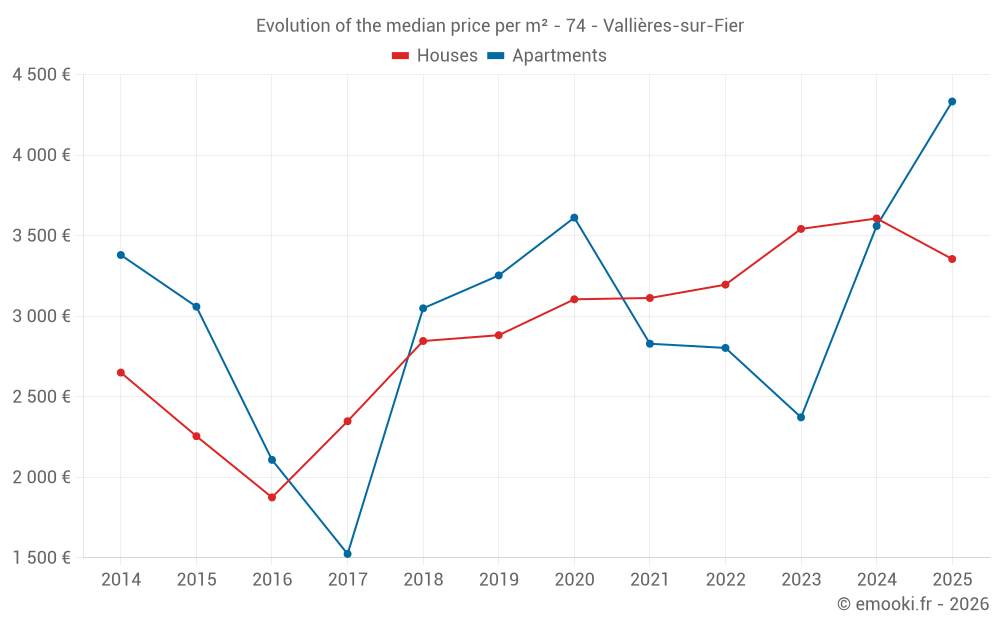
Median price of real estate
in the municipality of Vallières-sur-Fier

HousesHouses
3 660  /m²
1-23-45-67-89-10
Reliability 8/10
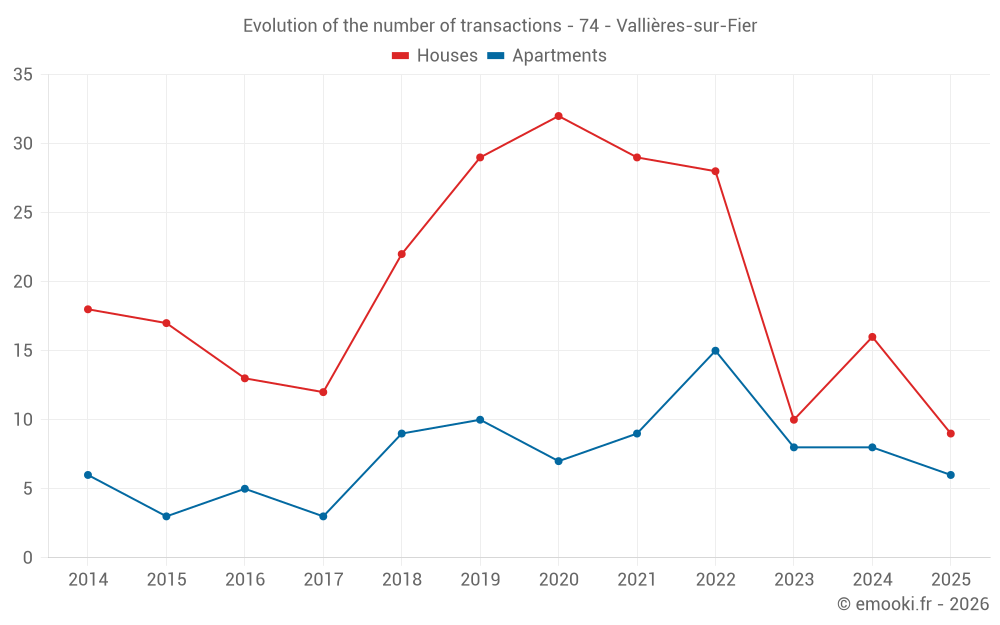
Median price on the 18 transactions of the last 12 months.
from 2 934 to
4 288  /m²
60% of transactions from the 2nd to the 8th deciles.
ApartmentsApartments
3 634  /m²
1-23-45-67-89-10
Reliability 7/10
Median price on the 17 transactions of the last 24 months.
from 3 021 to
4 370  /m²
60% of transactions from the 2nd to the 8th deciles.
DwellingsDwellings
3 783  /m²
1-23-45-67-89-10
Reliability 8/10
Median price on the 30 transactions of the last 12 months.
from 3 092 to
4 363  /m²
60% of transactions from the 2nd to the 8th deciles.
HousesEvolution of the price per m² of houses since...
1 year
-7%
2 years
-5.3%
3 years
+5%
4 years
+7.8%
5 years
+8.1%
6 years
+16%
7 years
+18%
8 years
+43%
9 years
+79%
10 years
+49%
11 years
+27%
The price per m² of houses has decreased by 7% since 1 year, but it has increased by 79% in 9 years.
ApartmentsEvolution of the price per m² of apartments since...
1 year
+22%
2 years
+83%
3 years
+55%
4 years
+53%
5 years
+20%
6 years
+33%
7 years
+42%
8 years
--
9 years
+106%
10 years
--
11 years
+28%

Yearly evolution

Evolution of the median price per m²

Evolution of the number of transactions

Warning, last year incomplete. Projections made based on the proportions between semesters of the previous year at the departmental/national level and by type of property.

Yearly data

Descending order
Year
Houses
house
transactions
Houses
house
Price per m²
Apartments
apt.
transactions
Apartments
apt.
Price per m²
2025
9
3 355 
6
4 333 
2024
16
3 607 
8
3 560 
2023
10
3 542 
8
2 372 
2022
28
3 196 
15
2 803 
2021
29
3 113 
9
2 829 
2020
32
3 105 
7
3 612 
2019
29
2 882 
10
3 253 
2018
22
2 846 
9
3 049 
2017
12
2 348 
3
1 524 
2016
13
1 875 
5
2 108 
2015
17
2 255 
3
3 059 
2014
18
2 650 
6
3 380 

Analysis

Structure of prices per m²

Values of price percentiles per m² over the periods used for the estimated price of each type of property.

Structure of transaction amounts

Values of transaction amounts percentiles over the periods used for the estimated price of each type of property.

Transaction amounts and prices per m² by percentile

Ascending order
Percentile
Houses
house
Price per m²
Houses
house
Transaction amount
Apartments
apt.
Price per m²
Apartments
apt.
Transaction amount
10th percentile
2 555 
124 K
1 604 
196 K
20th percentile
2 934 
258 K
3 021 
211 K
30th percentile
3 191 
334 K
3 160 
218 K
40th percentile
3 339 
342 K
3 304 
248 K
50th percentile
3 660 
359 K
3 634 
260 K
60th percentile
3 853 
370 K
4 001 
272 K
70th percentile
4 017 
380 K
4 220 
299 K
80th percentile
4 288 
413 K
4 370 
309 K
90th percentile
4 442 
440 K
4 826 
344 K

National and departmental comparison

Evolution of the median price per m² of houses

Evolution of the median price per m² of apartments

Quarterly evolution

Evolution of the median price per m²

Evolution of the number of transactions

Quarterly data

Descending order
Quarter
Houses
house
transactions
Houses
house
Price per m²
Apartments
apt.
transactions
Apartments
apt.
Price per m²
2025 Q2
4
2 950 
1
3 000 
2025 Q1
5
3 753 
5
4 394 
2024 Q4
5
3 182 
3
3 634 
2024 Q3
4
4 238 
3
3 182 
2024 Q2
1
2 799 
1
3 486 
2024 Q1
6
3 574 
1
4 609 
2023 Q4
4
4 363 
1
1 732 
2023 Q3
1
3 076 
2
1 140 
2023 Q2
4
3 292 
4
3 439 
2023 Q1
1
4 842 
1
3 722 
2022 Q4
6
2 835 
3
4 413 
2022 Q3
8
2 756 
10
2 670 
2022 Q2
8
2 924 
1
4 150 
2022 Q1
6
3 472 
1
2 423 
2021 Q4
9
3 950 
3
1 772 
2021 Q3
8
2 168 
3
3 565 
2021 Q2
6
3 164 
1
3 375 
2021 Q1
6
3 277 
2
2 072 
2020 Q4
10
2 736 
1
3 718 
2020 Q3
12
2 384 
5
3 612 
2020 Q2
6
3 403 
0
--- 
2020 Q1
4
2 582 
1
3 338 
2019 Q4
8
3 061 
1
2 330 
2019 Q3
6
3 336 
3
3 281 
2019 Q2
10
2 870 
3
3 225 
2019 Q1
5
2 421 
3
3 449 
2018 Q4
5
3 060 
3
3 049 
2018 Q3
5
2 951 
1
3 071 
2018 Q2
6
2 756 
3
3 124 
2018 Q1
6
2 224 
2
2 658 
2017 Q4
4
2 178 
1
716 
2017 Q3
5
2 857 
1
2 789 
2017 Q2
2
2 191 
0
--- 
2017 Q1
1
1 560 
1
1 524 
2016 Q4
2
962 
3
2 108 
2016 Q3
3
2 701 
1
1 701 
2016 Q2
3
1 875 
0
--- 
2016 Q1
5
2 617 
1
2 129 
2015 Q4
3
2 474 
1
2 662 
2015 Q3
7
2 016 
1
3 059 
2015 Q2
3
2 282 
0
--- 
2015 Q1
4
2 321 
1
3 096 
2014 Q4
7
2 378 
2
2 270 
2014 Q3
6
2 690 
1
3 388 
2014 Q2
3
2 781 
1
3 673 
2014 Q1
2
2 212 
2
3 421 

Overview of the latest real estate transactions

The following list is an anonymized overview of the latest transactions. For more details and to find all transactions, please use the map to view transactions by plot or the transaction search page for a search by criteria.

2025-05-28
344 000 
3 276  /m²(105 m²)
Sale
Houses
House
6 rooms
105 m2
Land
1197 m2
-Sols
2025-05-26
177 968 
transaction.nature.Vente terrain à bâtir
Land
700 m2
-Sols
2025-05-07
526 000 
2 391  /m²(220 m²)
Sale
Houses
House
8 rooms
220 m2
1 outbuilding
Land
879 m2
-Terres
Land
156 m2
-Terres
Land
39 m2
-Sols
2025-05-07
180 000 
3 000  /m²(60 m²)
Sale
Apartments
Apartment
3 rooms
60 m2
2 outbuildings
2025-05-05
21 000 
2 625  /m²(8 m²)
Sale
Houses
House
8 m2
Land
215 m2
-Sols
Land
13 m2
-Terres
Land
1223 m2
-Terres
2025-04-22
720 
Sale
Land
36 m2
-Terres
2025-04-11
270 000 
4 355  /m²(62 m²)
Sale
Houses
House
2 rooms
62 m2
Land
1150 m2
-Sols
2025-03-28
340 
Sale
Land
17 m2
-Terres
2025-03-28
1 340 
Sale
Land
67 m2
-Sols
2025-03-27
600 
Sale
Land
560 m2
-Taillis simples
Land
509 m2
-Prés
Land
575 m2
-Taillis simples
Land
320 m2
-Taillis simples
Land
430 m2
-Taillis simples
2025-03-24
211 180 
5 151  /m²(41 m²)
Sale
Apartments
Apartment
2 rooms
41 m2
3 outbuildings
2025-03-18
1 000 
Sale
Land
50 m2
-Sols
2025-03-18
2 060 
Sale
Land
60 m2
-Sols
Land
12 m2
-Terres
Land
31 m2
-Terres
2025-03-18
309 500 
4 127  /m²(75 m²)
Sale
Apartments
Apartment
3 rooms
75 m2
2 outbuildings
2025-03-11
900 
Sale
Land
45 m2
-Sols
2025-03-10
453 000 
4 441  /m²(102 m²)
Sale
Houses
House
5 rooms
102 m2
1 outbuilding
Land
1002 m2
-Sols
2025-03-10
364 050 
5 201  /m²(70 m²)
Sale
Apartments
Apartment
3 rooms
70 m2
1 outbuilding
2025-03-06
434 250 
2 857  /m²(152 m²)
Sale
Houses
House
6 rooms
152 m2
Land
1359 m2
-Sols
Land
476 m2
-Sols
2025-03-05
206 500 
4 394  /m²(47 m²)
Sale
Apartments
Apartment
2 rooms
47 m2
1 outbuilding
2025-02-28
381 100 
4 188  /m²(91 m²)
Sale
Houses
House
4 rooms
91 m2
Land
463 m2
-Sols
771 transactions listed in the municipality

Haute-Savoie (74)

Most expensive cities

City
name
Descending orderHouses
house
Price per m²
15 679 
13 070 
12 664 
12 078 
11 412 
11 019 
10 026 
9 621 
City
name
Descending orderApartments
apt.
Price per m²
9 603 
8 676 
8 394 
7 898 
7 778 
6 792 
6 625 
6 373 

Least expensive cities

City
name
Ascending orderHouses
house
Price per m²
2 070 
2 093 
2 300 
2 436 
2 611 
2 622 
2 709 
2 733 
City
name
Ascending orderApartments
apt.
Price per m²
725 
1 145 
1 250 
1 405 
1 448 
1 548 
1 628 
1 632 
1 674 
1 729