emooki
HomePrice mapTransactions
🇬🇧 English🇫🇷 Français🇩🇪 Deutsch🇪🇸 Español🇮🇹 Italiano

Real estate price map


Real estate price map in the municipality of Peillonnex, choose a section to see transactions by parcel.

Haute-Savoie (74)
Peillonnex

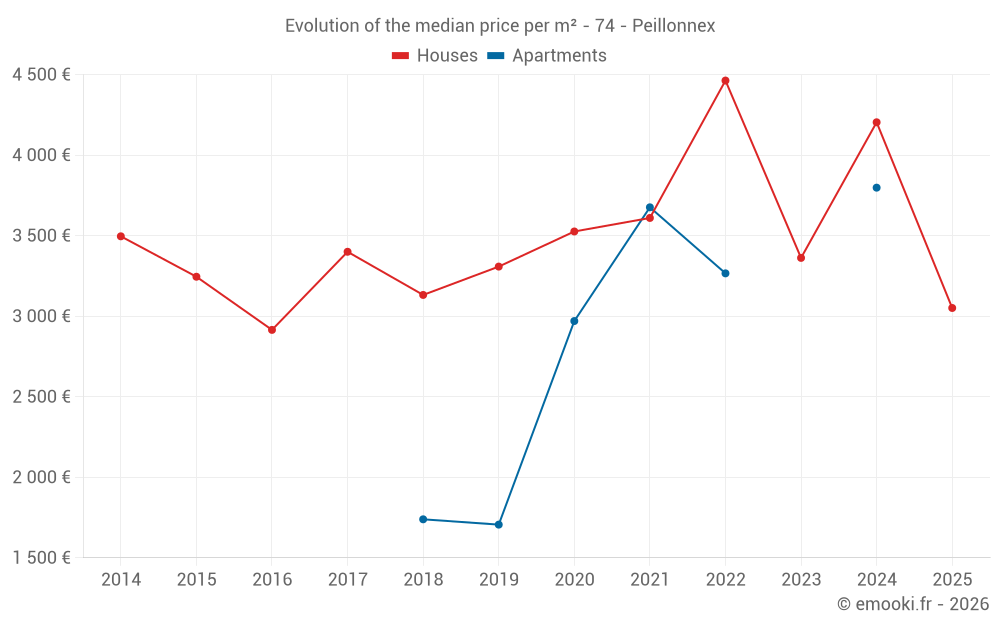
Median price of real estate
in the municipality of Peillonnex

HousesHouses
3 276 € /m²
1-23-45-67-89-10
Reliability 7/10
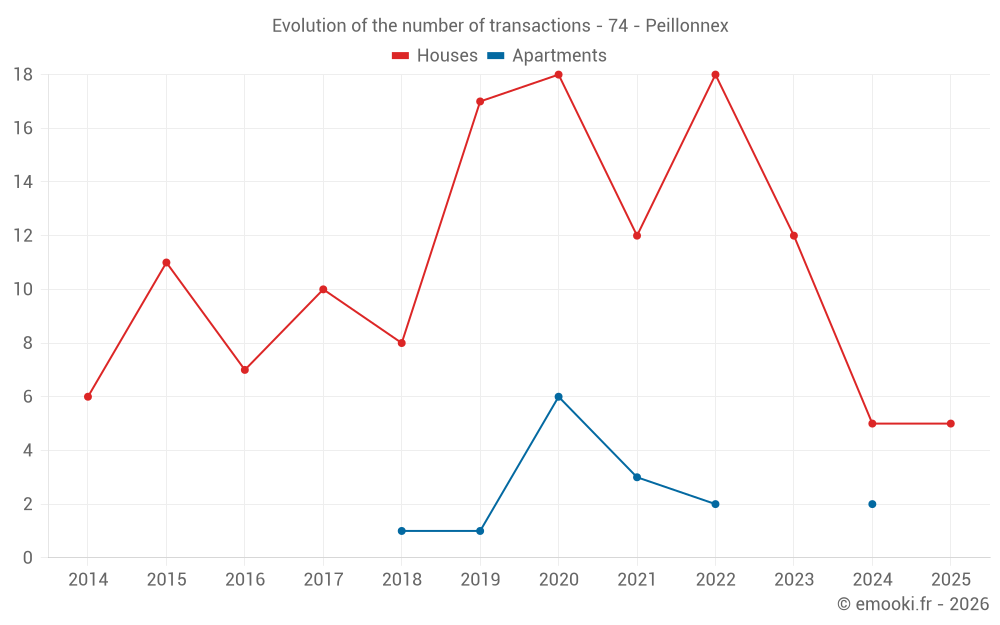
Median price on the 16 transactions of the last 24 months.
from 3 022 to
4 944 € /m²
60% of transactions from the 2nd to the 8th deciles.
ApartmentsApartments
3 500 € /m²
1-23-45-67-89-10
Reliability 4/10
Median price on the 11 transactions of the last 60 months.
from 3 033 to
3 684 € /m²
60% of transactions from the 2nd to the 8th deciles.
DwellingsDwellings
3 420 € /m²
1-23-45-67-89-10
Reliability 7/10
Median price on the 18 transactions of the last 24 months.
from 3 034 to
4 648 € /m²
60% of transactions from the 2nd to the 8th deciles.
HousesEvolution of the price per m² of houses since...
1 year
-27%
2 years
-9.3%
3 years
-32%
4 years
-15%
5 years
-13%
6 years
-7.8%
7 years
-2.6%
8 years
-10%
9 years
+4.7%
10 years
-6%
11 years
-13%
The price per m² of houses has decreased by 32% since 3 years, but it has increased by 4.7% in 9 years.

Yearly evolution

Evolution of the median price per m²

Evolution of the median price per m² - 74 - Peillonnex

Evolution of the number of transactions

Warning, last year incomplete. Projections made based on the proportions between semesters of the previous year at the departmental/national level and by type of property.

Evolution of the number of transactions - 74 - Peillonnex

Yearly data

Descending order
Year
Houses
house
transactions
Houses
house
Price per m²
Apartments
apt.
transactions
Apartments
apt.
Price per m²
2025
5
3 051 €
0
--- €
2024
5
4 204 €
2
3 798 €
2023
12
3 362 €
0
--- €
2022
18
4 463 €
2
3 266 €
2021
12
3 610 €
3
3 676 €
2020
18
3 526 €
6
2 970 €
2019
17
3 308 €
1
1 706 €
2018
8
3 132 €
1
1 739 €
2017
10
3 400 €
0
--- €
2016
7
2 915 €
0
--- €
2015
11
3 245 €
0
--- €
2014
6
3 496 €
0
--- €

Analysis

Structure of prices per m²

Values of price percentiles per m² over the periods used for the estimated price of each type of property.

Structure of transaction amounts

Values of transaction amounts percentiles over the periods used for the estimated price of each type of property.

Transaction amounts and prices per m² by percentile

Ascending order
Percentile
Houses
house
Price per m²
Houses
house
Transaction amount
Apartments
apt.
Price per m²
Apartments
apt.
Transaction amount
10th percentile
2 103 €
307 K€
3 000 €
165 K€
20th percentile
3 022 €
320 K€
3 033 €
180 K€
30th percentile
3 096 €
400 K€
3 250 €
182 K€
40th percentile
3 175 €
475 K€
3 315 €
201 K€
50th percentile
3 276 €
494 K€
3 500 €
210 K€
60th percentile
3 544 €
518 K€
3 587 €
242 K€
70th percentile
3 901 €
542 K€
3 676 €
250 K€
80th percentile
4 944 €
554 K€
3 684 €
280 K€
90th percentile
5 234 €
558 K€
3 913 €
347 K€

National and departmental comparison

Evolution of the median price per m² of houses

Evolution of the median price per m² of apartments

Quarterly evolution

Evolution of the median price per m²

Evolution of the number of transactions

Quarterly data

Descending order
Quarter
Houses
house
transactions
Houses
house
Price per m²
Apartments
apt.
transactions
Apartments
apt.
Price per m²
2025 Q2
2
2 103 €
0
--- €
2025 Q1
3
3 256 €
0
--- €
2024 Q4
1
5 045 €
1
3 684 €
2024 Q3
1
3 175 €
0
--- €
2024 Q2
1
4 204 €
1
3 913 €
2024 Q1
2
4 360 €
0
--- €
2023 Q4
2
3 283 €
0
--- €
2023 Q3
4
4 042 €
0
--- €
2023 Q2
1
4 626 €
0
--- €
2023 Q1
5
3 179 €
0
--- €
2022 Q4
7
4 624 €
0
--- €
2022 Q3
2
3 828 €
1
3 500 €
2022 Q2
5
4 578 €
1
3 033 €
2022 Q1
4
3 977 €
0
--- €
2021 Q4
3
3 885 €
0
--- €
2021 Q3
3
3 016 €
1
3 676 €
2021 Q2
2
1 930 €
0
--- €
2021 Q1
4
3 772 €
2
3 644 €
2020 Q4
4
3 138 €
3
3 000 €
2020 Q3
4
3 516 €
1
3 315 €
2020 Q2
3
1 667 €
2
2 243 €
2020 Q1
7
3 648 €
0
--- €
2019 Q4
4
2 996 €
0
--- €
2019 Q3
5
2 814 €
0
--- €
2019 Q2
5
3 664 €
0
--- €
2019 Q1
3
3 435 €
1
1 706 €
2018 Q4
1
3 109 €
0
--- €
2018 Q3
1
3 154 €
1
1 739 €
2018 Q2
4
3 241 €
0
--- €
2018 Q1
2
3 068 €
0
--- €
2017 Q4
2
3 903 €
0
--- €
2017 Q3
3
3 611 €
0
--- €
2017 Q2
3
3 119 €
0
--- €
2017 Q1
2
2 085 €
0
--- €
2016 Q4
5
2 786 €
0
--- €
2016 Q3
1
4 219 €
0
--- €
2016 Q2
1
3 222 €
0
--- €
2015 Q4
3
3 462 €
0
--- €
2015 Q3
4
3 262 €
0
--- €
2015 Q2
2
2 962 €
0
--- €
2015 Q1
2
3 090 €
0
--- €
2014 Q4
2
4 140 €
0
--- €
2014 Q3
1
3 199 €
0
--- €
2014 Q2
2
3 740 €
0
--- €
2014 Q1
1
2 711 €
0
--- €

Overview of the latest real estate transactions

The following list is an anonymized overview of the latest transactions. For more details and to find all transactions, please use the map to view transactions by plot or the transaction search page for a search by criteria.

2025-06-06
250 000 €
2 119 € /m²(118 m²)
Sale
Houses
House
4 rooms
118 m2
Land
1000 m2
-Sols
2025-05-22
480 000 €
2 087 € /m²(230 m²)
Sale
Houses
House
3 rooms
230 m2
1 outbuilding
Land
641 m2
-Sols
Land
471 m2
-Sols
Land
482 m2
-Sols
2025-05-14
700 000 €
Sale
Land
184 m2
-Prés plantes
Land
3315 m2
-Terres
2025-04-07
3 284 €
Sale
Land
1642 m2
-Terres
2025-03-31
475 000 €
3 598 € /m²(132 m²)
Sale
Houses
House
4 rooms
132 m2
2025-03-28
560 000 €
3 256 € /m²(172 m²)
Sale
Houses
House
7 rooms
172 m2
2 outbuildings
Land
1161 m2
-Sols
Land
870 m2
-Sols
Land
828 m2
-Sols
Land
79 m2
-Terres
Land
93 m2
-Terres
Land
152 m2
-Terres
Land
77 m2
-Terres
2025-03-21
537 000 €
3 051 € /m²(176 m²)
Sale
Apartments
Apartment
1 room
30 m2
Land
256 m2
-Sols
Houses
House
5 rooms
146 m2
2 outbuildings
Land
304 m2
-Sols
Land
208 m2
-Sols
Land
584 m2
-Jardins
Land
534 m2
-Prés
Land
2086 m2
-Terres
2025-02-06
2 523 €
Sale
Land
1009 m2
-Terres
2025-02-04
210 000 €
transaction.nature.Vente terrain à bâtir
Land
492 m2
-Sols
Land
21 m2
-Sols
2025-01-03
4 000 €
Sale
1 outbuilding
Land
53 m2
-Jardins
2024-12-18
227 000 €
Sale
Land
746 m2
-Sols
2024-12-17
350 000 €
3 684 € /m²(95 m²)
Sale
Apartments
Apartment
3 rooms
95 m2
3 outbuildings
2024-11-13
555 000 €
5 045 € /m²(110 m²)
Sale
Houses
House
4 rooms
110 m2
1 outbuilding
Land
960 m2
-Sols
Land
40 m2
-Sols
2024-11-04
832 €
Sale
Land
1663 m2
-Futaies résineuses
/Sapins ou sapinière
2024-10-29
60 000 €
Sale
Land
389 m2
-Sols
Land
1039 m2
-Prés
Land
295 m2
-Sols
2024-10-21
1 280 €
Sale
Land
2560 m2
-Taillis simples
2024-09-24
1 280 €
Sale
Land
2560 m2
-Taillis simples
2024-09-20
1 472 €
Sale
Land
3143 m2
-Futaies résineuses
/Sapins ou sapinière
Land
1763 m2
-Futaies résineuses
/Sapins ou sapinière
2024-07-18
435 000 €
3 175 € /m²(137 m²)
Sale
Houses
House
5 rooms
137 m2
Land
103 m2
-Sols
Land
395 m2
-Landes
/Friche
Land
2495 m2
-Landes
/Friche
2024-06-28
160 000 €
Sale
Land
6 m2
-Prés
Land
366 m2
-Prés
Land
345 m2
-Prés
Land
40 m2
-Prés
265 transactions listed in the municipality

Haute-Savoie (74)

Most expensive cities

City
name
Descending orderHouses
house
Price per m²
15 679 €
14 387 €
13 070 €
12 664 €
12 078 €
11 412 €
11 019 €
10 026 €
9 621 €
9 458 €
City
name
Descending orderApartments
apt.
Price per m²
9 770 €
9 603 €
8 676 €
8 394 €
7 898 €
7 778 €
6 804 €
6 792 €
6 625 €
6 373 €

Least expensive cities

City
name
Ascending orderHouses
house
Price per m²
2 070 €
2 093 €
2 300 €
2 436 €
2 522 €
2 611 €
2 622 €
2 709 €
2 733 €
City
name
Ascending orderApartments
apt.
Price per m²
725 €
1 145 €
1 250 €
1 405 €
1 448 €
1 548 €
1 628 €
1 632 €
1 674 €
1 729 €