emooki
HomePrice mapTransactions
🇬🇧 English🇫🇷 Français🇩🇪 Deutsch🇪🇸 Español🇮🇹 Italiano

Real estate price map


Real estate price map in the municipality of Neydens, choose a section to see transactions by parcel.

Haute-Savoie (74)

Neydens - Real estate price m²

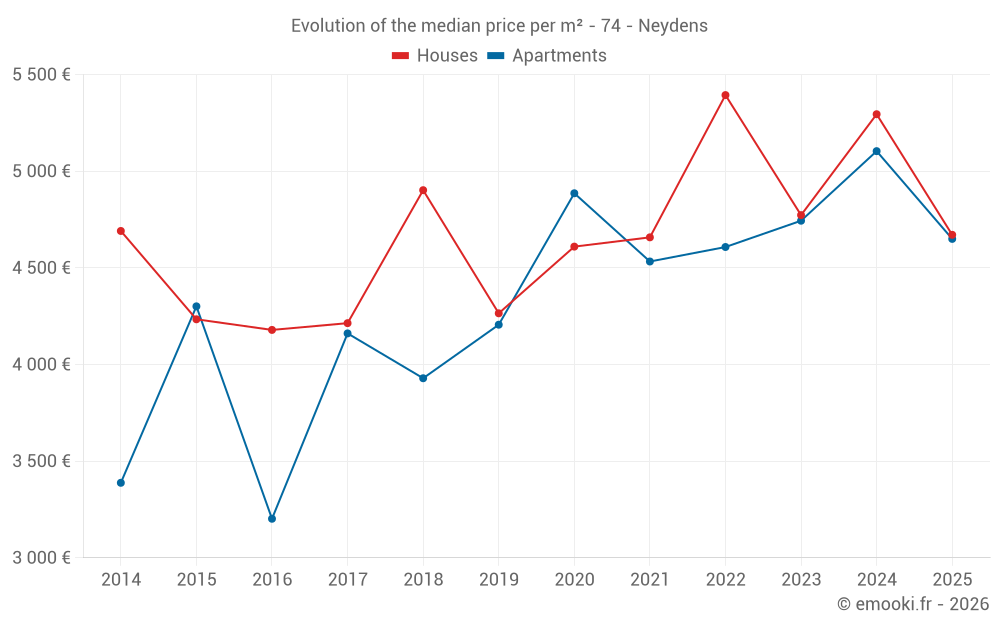
Median price of real estate
in the municipality of Neydens

HousesHouses
5 171  /m²
1-23-45-67-89-10
Reliability 7/10
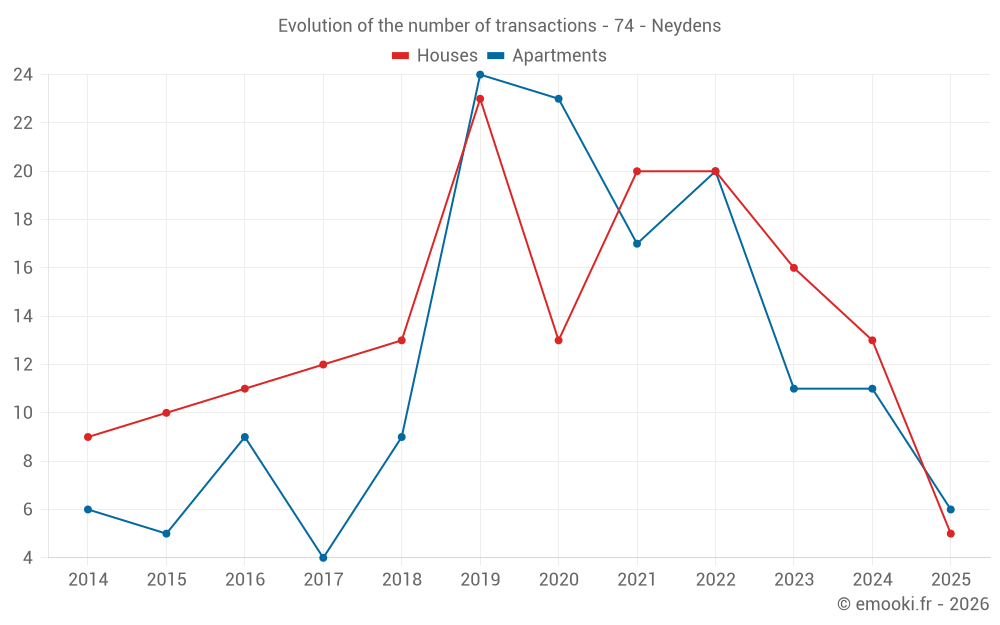
Median price on the 25 transactions of the last 24 months.
from 4 066 to
6 284  /m²
60% of transactions from the 2nd to the 8th deciles.
ApartmentsApartments
5 078  /m²
1-23-45-67-89-10
Reliability 7/10
Median price on the 21 transactions of the last 24 months.
from 3 457 to
5 566  /m²
60% of transactions from the 2nd to the 8th deciles.
DwellingsDwellings
5 104  /m²
1-23-45-67-89-10
Reliability 8/10
Median price on the 23 transactions of the last 12 months.
from 3 924 to
5 700  /m²
60% of transactions from the 2nd to the 8th deciles.
HousesEvolution of the price per m² of houses since...
1 year
-12%
2 years
-2.1%
3 years
-13%
4 years
+0.3%
5 years
+1.3%
6 years
+10%
7 years
-4.7%
8 years
+11%
9 years
+12%
10 years
+10%
11 years
-0.4%
The price per m² of houses has decreased by 13% since 3 years, but it has increased by 12% in 9 years.
ApartmentsEvolution of the price per m² of apartments since...
1 year
-8.9%
2 years
-2%
3 years
+0.9%
4 years
+2.6%
5 years
-4.8%
6 years
+11%
7 years
+18%
8 years
+12%
9 years
+45%
10 years
+8.1%
11 years
+37%
The price per m² of apartments has decreased by 8.9% since 1 year, but it has increased by 45% in 9 years.

Yearly evolution

Evolution of the median price per m²

Evolution of the median price per m² - 74 - Neydens

Evolution of the number of transactions

Warning, last year incomplete. Projections made based on the proportions between semesters of the previous year at the departmental/national level and by type of property.

Evolution of the number of transactions - 74 - Neydens

Yearly data

Descending order
Year
Houses
house
transactions
Houses
house
Price per m²
Apartments
apt.
transactions
Apartments
apt.
Price per m²
2025
5
4 671 
6
4 650 
2024
13
5 295 
11
5 104 
2023
16
4 773 
11
4 744 
2022
20
5 394 
20
4 608 
2021
20
4 658 
17
4 533 
2020
13
4 610 
23
4 886 
2019
23
4 265 
24
4 206 
2018
13
4 902 
9
3 929 
2017
12
4 214 
4
4 161 
2016
11
4 179 
9
3 202 
2015
10
4 234 
5
4 301 
2014
9
4 691 
6
3 388 

Analysis

Structure of prices per m²

Values of price percentiles per m² over the periods used for the estimated price of each type of property.

Structure of transaction amounts

Values of transaction amounts percentiles over the periods used for the estimated price of each type of property.

Transaction amounts and prices per m² by percentile

Ascending order
Percentile
Houses
house
Price per m²
Houses
house
Transaction amount
Apartments
apt.
Price per m²
Apartments
apt.
Transaction amount
10th percentile
3 312 
404 K
3 105 
230 K
20th percentile
4 066 
510 K
3 457 
236 K
30th percentile
4 643 
544 K
3 735 
265 K
40th percentile
4 661 
585 K
4 702 
270 K
50th percentile
5 171 
650 K
5 078 
299 K
60th percentile
5 376 
675 K
5 297 
345 K
70th percentile
5 709 
743 K
5 399 
368 K
80th percentile
6 284 
836 K
5 566 
461 K
90th percentile
7 261 
874 K
5 759 
505 K

National and departmental comparison

Evolution of the median price per m² of houses

Evolution of the median price per m² of apartments

Quarterly evolution

Evolution of the median price per m²

Evolution of the number of transactions

Quarterly data

Descending order
Quarter
Houses
house
transactions
Houses
house
Price per m²
Apartments
apt.
transactions
Apartments
apt.
Price per m²
2025 Q2
1
4 114 
0
--- 
2025 Q1
4
5 194 
6
4 650 
2024 Q4
4
4 814 
3
5 297 
2024 Q3
3
5 314 
2
3 364 
2024 Q2
5
5 468 
2
4 073 
2024 Q1
1
3 650 
4
5 438 
2023 Q4
3
6 241 
3
4 702 
2023 Q3
4
4 673 
1
6 091 
2023 Q2
5
4 843 
5
4 746 
2023 Q1
4
4 315 
2
5 046 
2022 Q4
5
4 643 
4
4 990 
2022 Q3
3
5 024 
5
5 966 
2022 Q2
7
5 756 
6
4 827 
2022 Q1
5
4 889 
5
4 552 
2021 Q4
3
4 026 
5
4 467 
2021 Q3
7
5 634 
5
4 683 
2021 Q2
6
4 472 
4
4 530 
2021 Q1
4
4 446 
3
4 323 
2020 Q4
4
5 569 
7
4 906 
2020 Q3
3
4 317 
8
5 170 
2020 Q2
3
5 261 
3
4 886 
2020 Q1
3
3 448 
5
4 663 
2019 Q4
4
4 520 
9
4 143 
2019 Q3
4
4 345 
9
4 508 
2019 Q2
8
3 570 
2
3 125 
2019 Q1
7
3 664 
4
4 125 
2018 Q4
5
3 624 
3
3 929 
2018 Q3
3
4 902 
5
4 272 
2018 Q2
3
5 113 
1
2 789 
2018 Q1
2
5 830 
0
--- 
2017 Q4
6
4 118 
4
4 161 
2017 Q3
2
3 690 
0
--- 
2017 Q2
2
3 238 
0
--- 
2017 Q1
2
5 015 
0
--- 
2016 Q4
5
2 949 
4
3 616 
2016 Q3
2
4 228 
3
3 202 
2016 Q2
3
4 932 
1
2 353 
2016 Q1
1
2 435 
1
4 364 
2015 Q4
2
4 656 
0
--- 
2015 Q3
3
4 097 
1
2 692 
2015 Q2
4
3 693 
3
4 301 
2015 Q1
1
4 301 
1
4 444 
2014 Q4
1
4 901 
3
2 401 
2014 Q3
4
4 688 
1
5 556 
2014 Q2
2
3 419 
1
36 
2014 Q1
2
7 322 
1
4 839 

Overview of the latest real estate transactions

The following list is an anonymized overview of the latest transactions. For more details and to find all transactions, please use the map to view transactions by plot or the transaction search page for a search by criteria.

2025-06-12
374 400 
4 114  /m²(91 m²)
Sale
Houses
House
3 rooms
91 m2
2025-04-22
1 
Sale
Land
17 m2
-Sols
2025-04-22
784 
Sale
Land
653 m2
-Prés
2025-03-28
594 500 
4 645  /m²(128 m²)
Sale
Houses
House
4 rooms
128 m2
Land
216 m2
-Sols
Land
90 m2
-Landes
2025-03-27
573 880 
5 739  /m²(100 m²)
Sale
Apartments
Apartment
4 rooms
100 m2
3 outbuildings
2025-03-24
350 640 
5 566  /m²(63 m²)
Sale
Apartments
Apartment
3 rooms
63 m2
2 outbuildings
2025-03-19
302 500 
3 735  /m²(81 m²)
Sale
Apartments
Apartment
4 rooms
81 m2
4 outbuildings
2025-03-14
280 000 
3 457  /m²(81 m²)
Sale
Apartments
Apartment
4 rooms
81 m2
4 outbuildings
2025-03-06
485 750 
4 671  /m²(104 m²)
Sale
Houses
House
4 rooms
104 m2
2 outbuildings
Land
82 m2
-Sols
1 outbuilding
Land
15 m2
-Terres
Land
105 m2
-Terres
Land
94 m2
-Jardins
2025-02-24
25 000 
Sale
1 outbuilding
2025-02-24
829 000 
5 717  /m²(145 m²)
Sale
Houses
House
7 rooms
145 m2
1 outbuilding
Land
1302 m2
-Sols
2025-02-14
3 225 
Sale
Land
8 m2
-Sols
Land
35 m2
-Sols
2025-02-14
300 
Sale
Land
4 m2
-Sols
2025-02-10
878 000 
10 092  /m²(87 m²)
Sale
Houses
House
3 rooms
87 m2
1 outbuilding
Land
909 m2
-Sols
2025-02-10
505 300 
8 422  /m²(60 m²)
Sale
Apartments
Apartment
2 rooms
30 m2
Apartments
Apartment
1 room
30 m2
2 outbuildings
Land
222 m2
-Sols
Land
10 m2
-Jardins
2025-02-04
15 000 
Sale
Land
355 m2
-Terres
2025-01-17
447 000 
3 438  /m²(130 m²)
Sale
Apartments
Apartment
4 rooms
130 m2
2024-12-30
865 000 
6 455  /m²(134 m²)
Sale
Houses
House
5 rooms
134 m2
2 outbuildings
Land
1050 m2
-Sols
2024-12-27
650 000 
724  /m²(898 m²)
Sale
Commercial property
898 m2
Land
4376 m2
-Sols
2024-11-28
868 380 
5 295  /m²(164 m²)
Sale
Houses
House
6 rooms
164 m2
Land
641 m2
-Sols
744 transactions listed in the municipality

Haute-Savoie (74)

Most expensive cities

City
name
Descending orderHouses
house
Price per m²
15 679 
13 070 
12 664 
12 078 
11 412 
11 019 
10 026 
9 621 
City
name
Descending orderApartments
apt.
Price per m²
9 603 
8 676 
8 394 
7 898 
7 778 
6 792 
6 625 
6 373 

Least expensive cities

City
name
Ascending orderHouses
house
Price per m²
2 070 
2 093 
2 300 
2 436 
2 611 
2 622 
2 709 
2 733 
City
name
Ascending orderApartments
apt.
Price per m²
725 
1 145 
1 250 
1 405 
1 448 
1 548 
1 628 
1 632 
1 674 
1 729