Real estate price map
Real estate price map in the municipality of Chapeiry, choose a section to see transactions by parcel.
Haute-Savoie (74)
Price per m² in Chapeiry
Median price of real estate
in the municipality of Chapeiry
Houses
5 035 € /m²
Reliability 6/10
Median price on the 18 transactions of the last 36 months.
from 3 897 to
5 258 € /m²
5 258 € /m²
60% of transactions from the 2nd to the 8th deciles.
Apartments
4 694 € /m²
Reliability 5/10
Median price on the 19 transactions of the last 48 months.
from 4 395 to
5 110 € /m²
5 110 € /m²
60% of transactions from the 2nd to the 8th deciles.
Dwellings
5 028 € /m²
Reliability 7/10
Median price on the 17 transactions of the last 24 months.
from 4 062 to
5 217 € /m²
5 217 € /m²
60% of transactions from the 2nd to the 8th deciles.
Yearly evolution
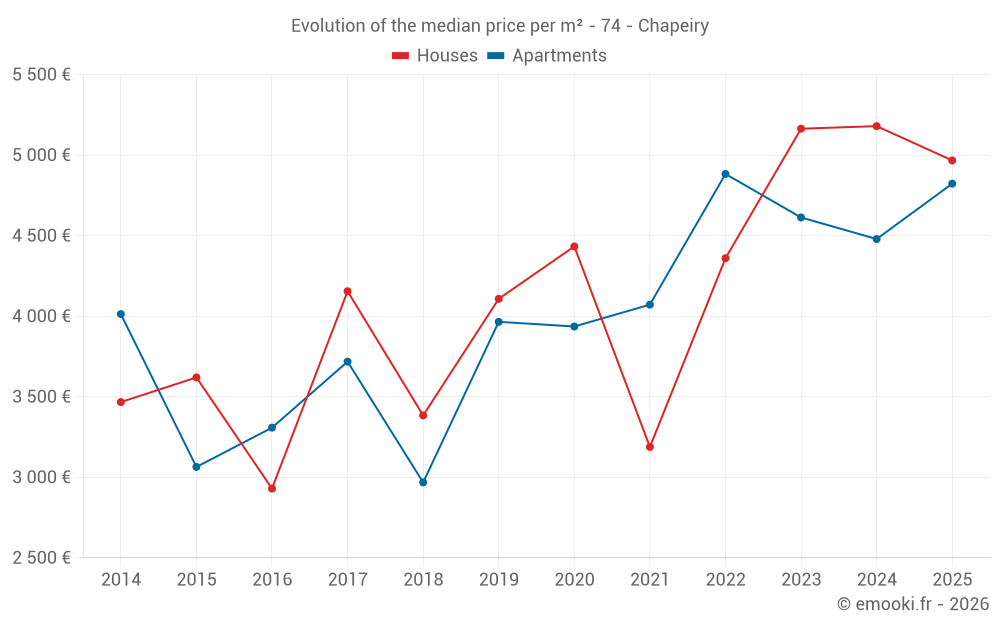
Evolution of the median price per m²
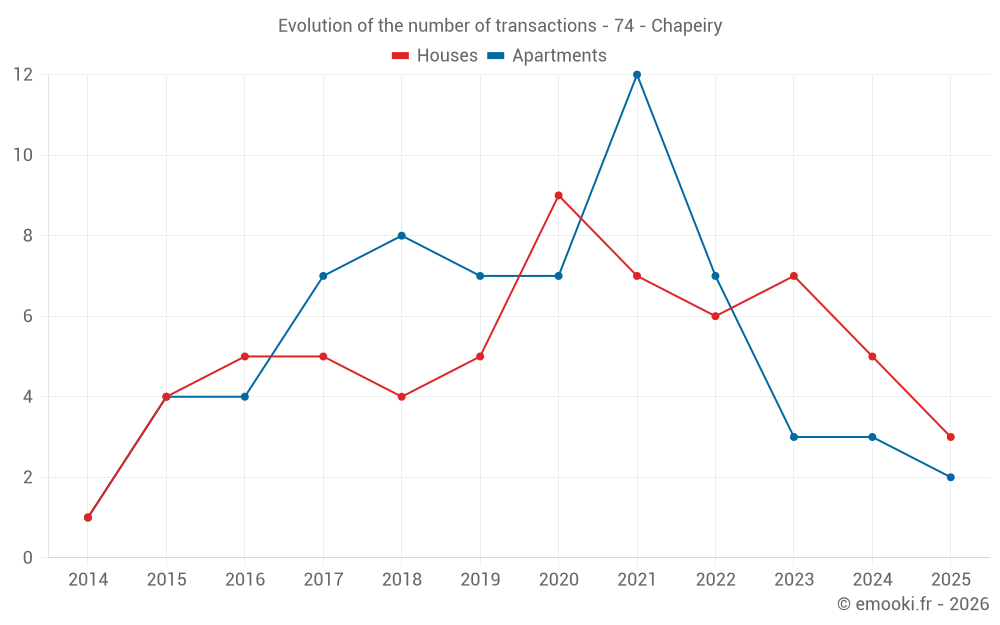
Evolution of the number of transactions
Warning, last year incomplete. Projections made based on the proportions between semesters of the previous year at the departmental/national level and by type of property.
Yearly data
Year
house
transactions
transactions
house
Price per m²
Price per m²
apt.
transactions
transactions
apt.
Price per m²
Price per m²
2025
3
4 967 €
2
4 823 €
2024
5
5 180 €
3
4 479 €
2023
7
5 164 €
3
4 613 €
2022
6
4 360 €
7
4 883 €
2021
7
3 188 €
12
4 072 €
2020
9
4 433 €
7
3 936 €
2019
5
4 108 €
7
3 965 €
2018
4
3 384 €
8
2 968 €
2017
5
4 155 €
7
3 718 €
2016
5
2 930 €
4
3 308 €
2015
4
3 620 €
4
3 064 €
2014
1
3 467 €
1
4 013 €
Analysis
Structure of prices per m²
Values of price percentiles per m² over the periods used for the estimated price of each type of property.
Structure of transaction amounts
Values of transaction amounts percentiles over the periods used for the estimated price of each type of property.
Transaction amounts and prices per m² by percentile
Percentile
house
Price per m²
Price per m²
house
Transaction amount
Transaction amount
apt.
Price per m²
Price per m²
apt.
Transaction amount
Transaction amount
10th percentile
3 638 €
426 K€
4 082 €
228 K€
20th percentile
3 897 €
437 K€
4 395 €
231 K€
30th percentile
4 639 €
457 K€
4 536 €
281 K€
40th percentile
4 962 €
527 K€
4 616 €
300 K€
50th percentile
5 035 €
546 K€
4 694 €
323 K€
60th percentile
5 088 €
600 K€
4 942 €
341 K€
70th percentile
5 178 €
700 K€
4 986 €
365 K€
80th percentile
5 258 €
736 K€
5 110 €
373 K€
90th percentile
6 364 €
761 K€
5 266 €
431 K€
National and departmental comparison
Evolution of the median price per m² of houses
Evolution of the median price per m² of apartments
Quarterly evolution
Evolution of the median price per m²
Evolution of the number of transactions
Quarterly data
Quarter
house
transactions
transactions
house
Price per m²
Price per m²
apt.
transactions
transactions
apt.
Price per m²
Price per m²
2025 Q2
1
5 033 €
0
--- €
2025 Q1
2
4 462 €
2
4 823 €
2024 Q4
4
5 662 €
0
--- €
2024 Q3
0
--- €
1
3 368 €
2024 Q2
1
3 856 €
1
4 479 €
2024 Q1
0
--- €
1
4 957 €
2023 Q4
1
5 280 €
0
--- €
2023 Q3
3
5 164 €
0
--- €
2023 Q2
0
--- €
2
4 548 €
2023 Q1
3
5 069 €
1
5 000 €
2022 Q4
1
3 780 €
0
--- €
2022 Q3
2
4 124 €
2
5 268 €
2022 Q2
1
4 254 €
2
4 749 €
2022 Q1
2
5 104 €
3
4 694 €
2021 Q4
2
3 678 €
4
4 618 €
2021 Q3
2
4 534 €
0
--- €
2021 Q2
3
3 188 €
6
4 072 €
2021 Q1
0
--- €
2
2 987 €
2020 Q4
2
4 353 €
2
4 120 €
2020 Q3
3
4 915 €
1
3 750 €
2020 Q2
1
4 433 €
0
--- €
2020 Q1
3
4 202 €
4
3 748 €
2019 Q4
1
8 058 €
2
4 245 €
2019 Q3
1
4 108 €
1
3 991 €
2019 Q2
1
1 497 €
1
3 433 €
2019 Q1
2
3 844 €
3
3 951 €
2018 Q4
1
3 592 €
2
3 305 €
2018 Q3
1
6 063 €
2
2 802 €
2018 Q2
1
1 040 €
1
3 621 €
2018 Q1
1
3 175 €
3
2 956 €
2017 Q4
1
4 420 €
2
3 812 €
2017 Q3
1
1 158 €
3
3 836 €
2017 Q2
1
852 €
0
--- €
2017 Q1
2
5 015 €
2
3 328 €
2016 Q4
3
2 914 €
1
3 474 €
2016 Q3
1
3 321 €
3
3 142 €
2016 Q1
1
4 570 €
0
--- €
2015 Q4
0
--- €
2
1 849 €
2015 Q3
2
3 584 €
1
2 896 €
2015 Q2
1
3 107 €
1
3 243 €
2015 Q1
1
4 133 €
0
--- €
2014 Q4
0
--- €
1
4 013 €
2014 Q3
1
3 467 €
0
--- €
Overview of the latest real estate transactions
The following list is an anonymized overview of the latest transactions. For more details and to find all transactions, please use the map to view transactions by plot or the transaction search page for a search by criteria.
2025-06-03
350 000 €Sale
Land
1158 m2
-Jardins
2025-05-16
25 000 €Sale
1 outbuilding
2025-05-06
453 000 €5 033 € /m²(90 m²)
Sale
House
4 rooms
90 m2
Land
89 m2
-Sols
Land
13 m2
-Sols
Land
20 m2
-Sols
Land
19 m2
-Sols
2025-05-05
300 €Sale
Land
30 m2
-Sols
2025-04-11
506 €Sale
Land
59 m2
-Sols
Land
156 m2
-Sols
Land
291 m2
-Sols
2025-04-05
6 000 €Sale
Land
1286 m2
-Taillis sous futaie
Land
1950 m2
-Terres
2025-04-05
12 000 €Sale
Land
2000 m2
-Terres
Land
2060 m2
-Terres
Land
310 m2
-Taillis simples
Land
1240 m2
-Prés
Land
3480 m2
-Prés
2025-03-31
432 170 €4 967 € /m²(87 m²)
Sale
House
4 rooms
87 m2
Land
112 m2
-Sols
Land
12 m2
-Sols
Land
133 m2
-Sols
2025-03-31
360 200 €4 618 € /m²(78 m²)
Sale
Apartment
4 rooms
78 m2
2 outbuildings
2025-03-27
380 000 €3 958 € /m²(96 m²)
Sale
House
3 rooms
96 m2
Land
110 m2
-Sols
Land
25 m2
-Landes
Land
269 m2
-Sols
Land
188 m2
-Terres
Land
208 m2
-Terres
Land
849 m2
-Prés
Land
298 m2
-Prés
2025-03-14
1 €Sale
Land
1 m2
-Prés
2025-02-12
226 250 €5 028 € /m²(45 m²)
Sale
Apartment
1 room
45 m2
2024-12-19
1 150 000 €5 180 € /m²(222 m²)
Sale
House
8 rooms
222 m2
1 outbuilding
Land
1910 m2
-Sols
Land
3125 m2
-Jardins
Land
1158 m2
-Jardins
2024-12-18
620 560 €6 144 € /m²(101 m²)
Sale
House
4 rooms
101 m2
2 outbuildings
Land
900 m2
-Sols
2024-12-05
740 000 €6 981 € /m²(106 m²)
Sale
House
4 rooms
106 m2
1 outbuilding
Land
1500 m2
-Sols
Land
1566 m2
-Jardins
Land
7 m2
-Prés
Land
255 m2
-Landes
Land
227 m2
-Landes
2024-10-03
412 000 €3 296 € /m²(125 m²)
Sale
House
5 rooms
125 m2
1 outbuilding
Land
363 m2
-Sols
Land
155 m2
-Landes
Land
625 m2
-Prés
Land
35 m2
-Prés
Land
620 m2
-Jardins
2024-07-05
370 500 €3 368 € /m²(110 m²)
Sale
Apartment
6 rooms
110 m2
1 outbuilding
2024-06-11
493 600 €3 856 € /m²(128 m²)
Sale
House
6 rooms
128 m2
Land
1297 m2
-Sols
2024-05-31
343 820 €Sale
Land
1700 m2
-Terrains à bâtir
Land
232 m2
-Terrains à bâtir
2024-05-29
300 100 €4 479 € /m²(67 m²)
Sale
Apartment
3 rooms
67 m2
2 outbuildings
289 transactions listed in the municipality
Compare with neighboring municipalities
City
name
name
house
Price per m²
Price per m²
apt.
Price per m²
Price per m²
City information
Zip code
- 74540 CHAPEIRY
Data source & update
- Latest publication of the property value request (DVF) database made available by the DGFiP on October 19, 2025, covering transactions up to 06/30/2025:
- Administrative/cadastral division as of September 1, 2025, and municipal movements as of January 1, 2025: